Over-50s
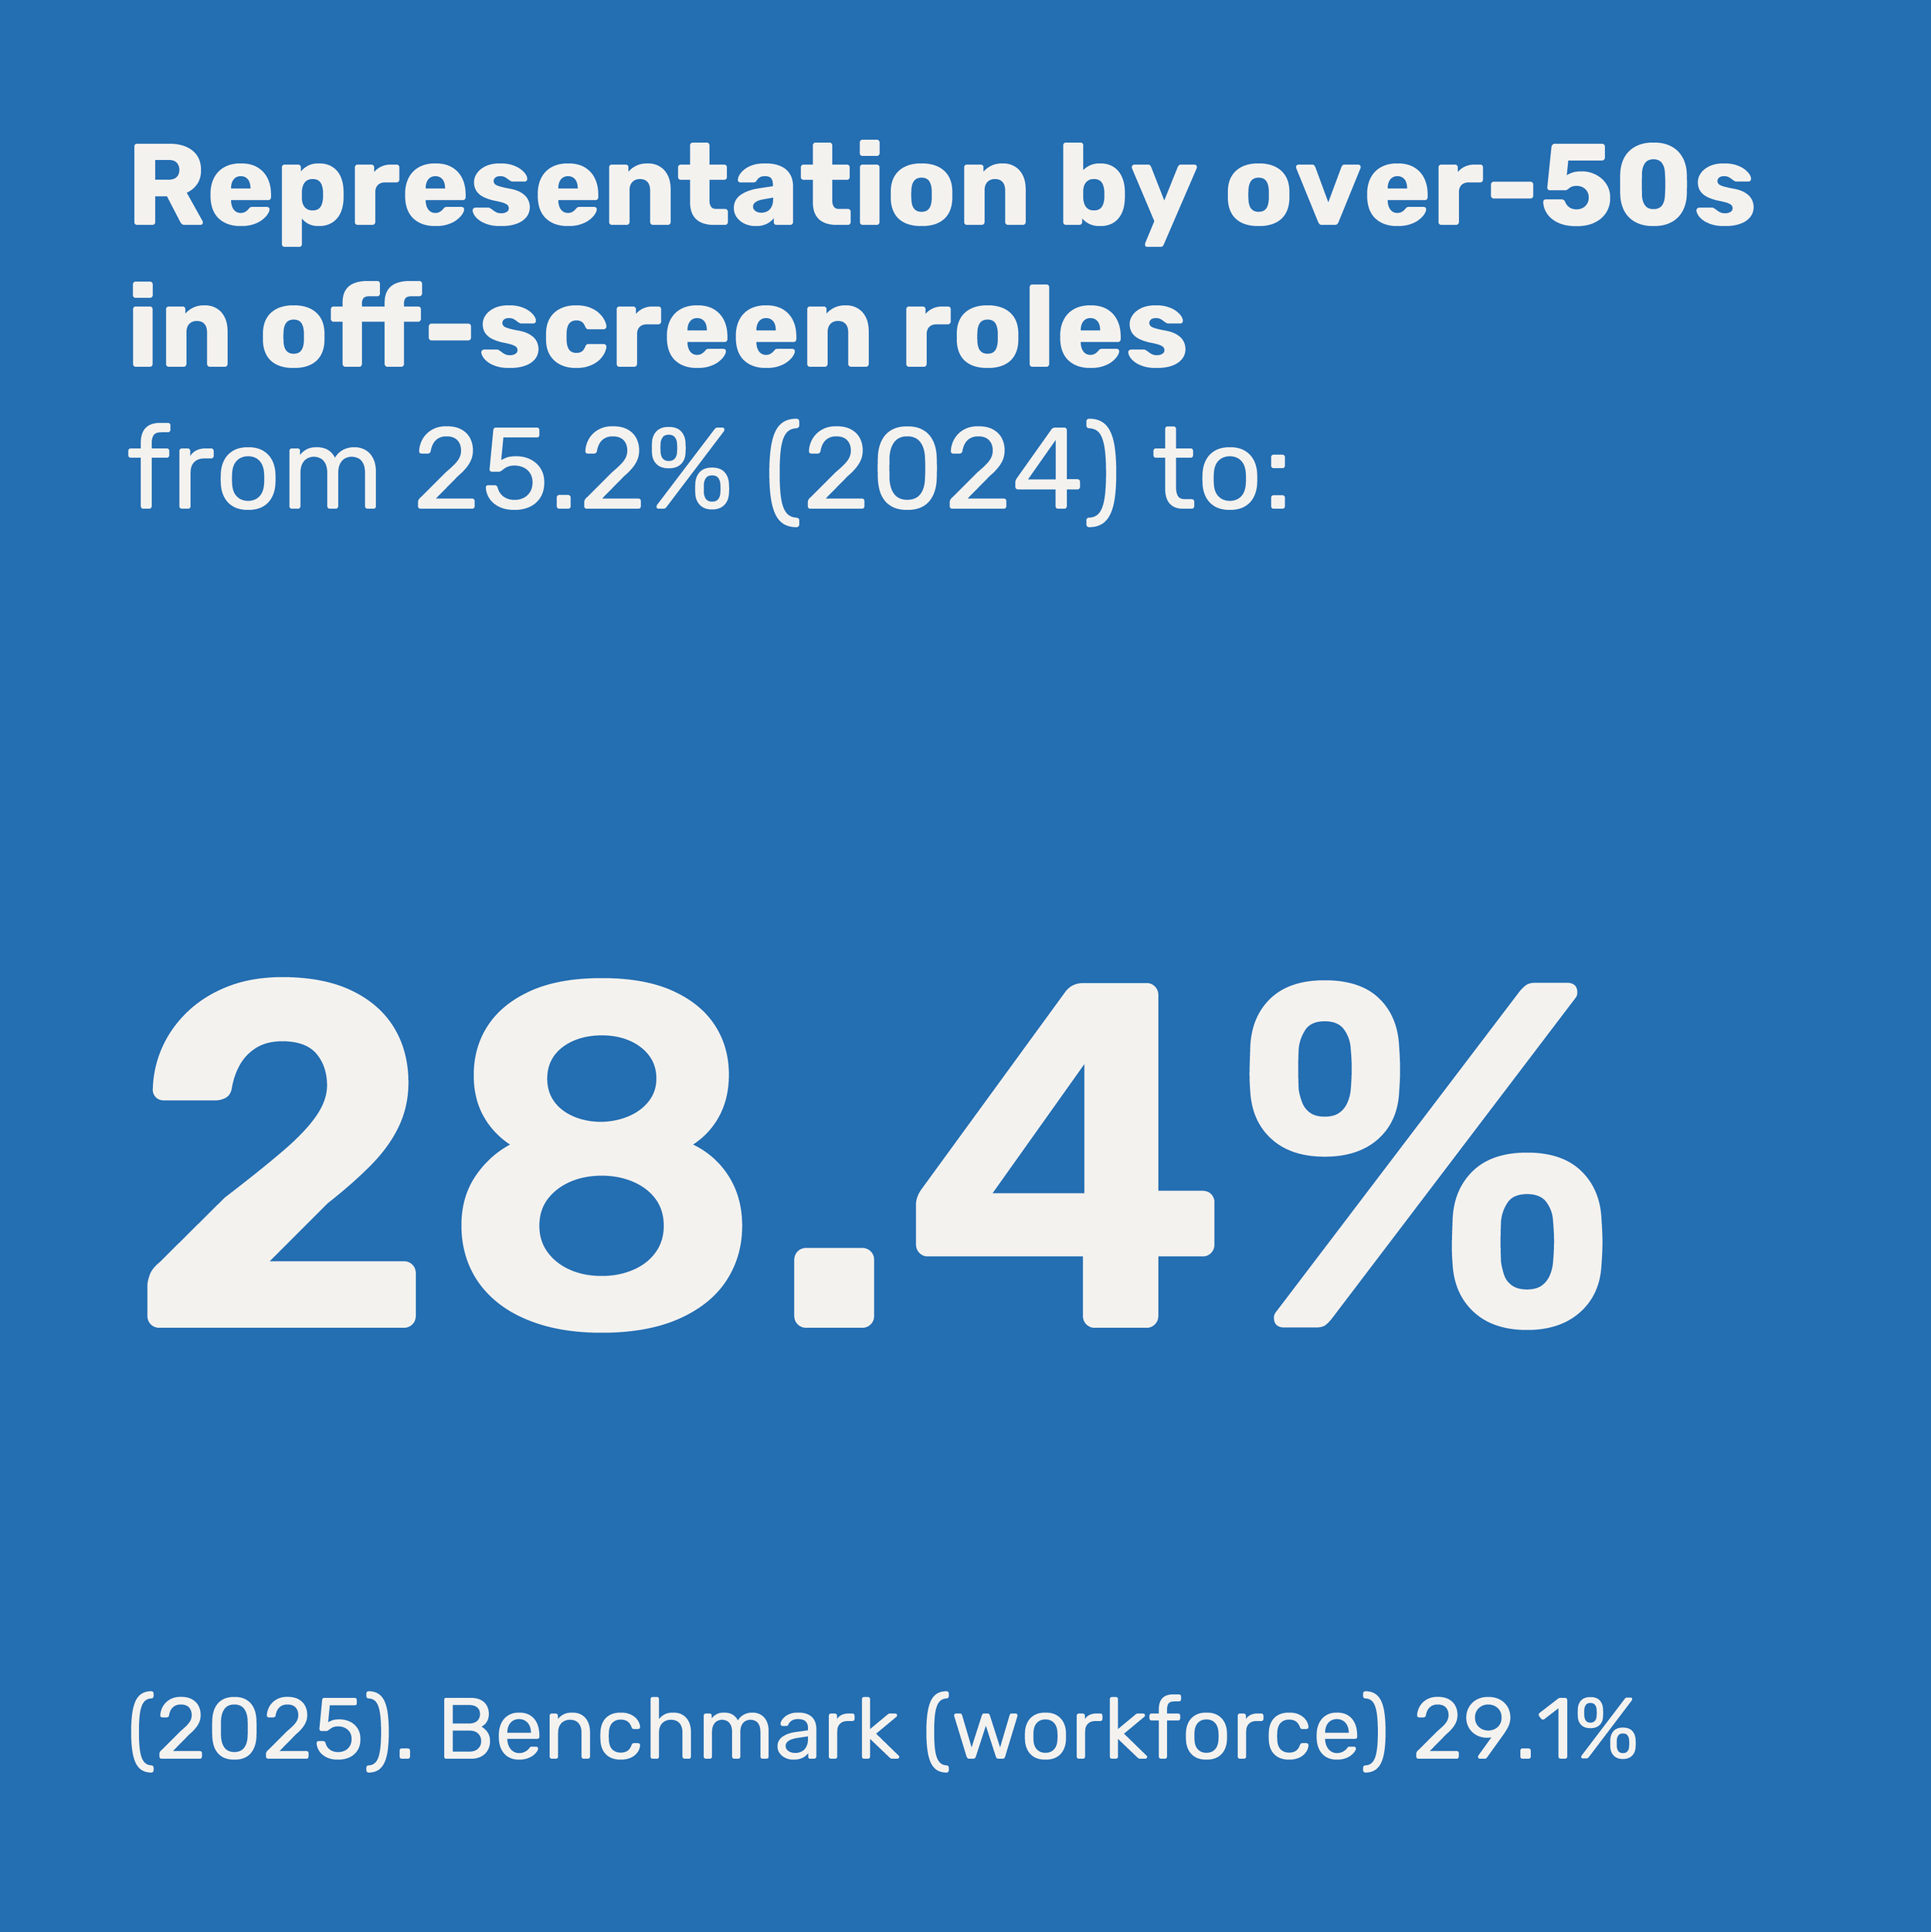
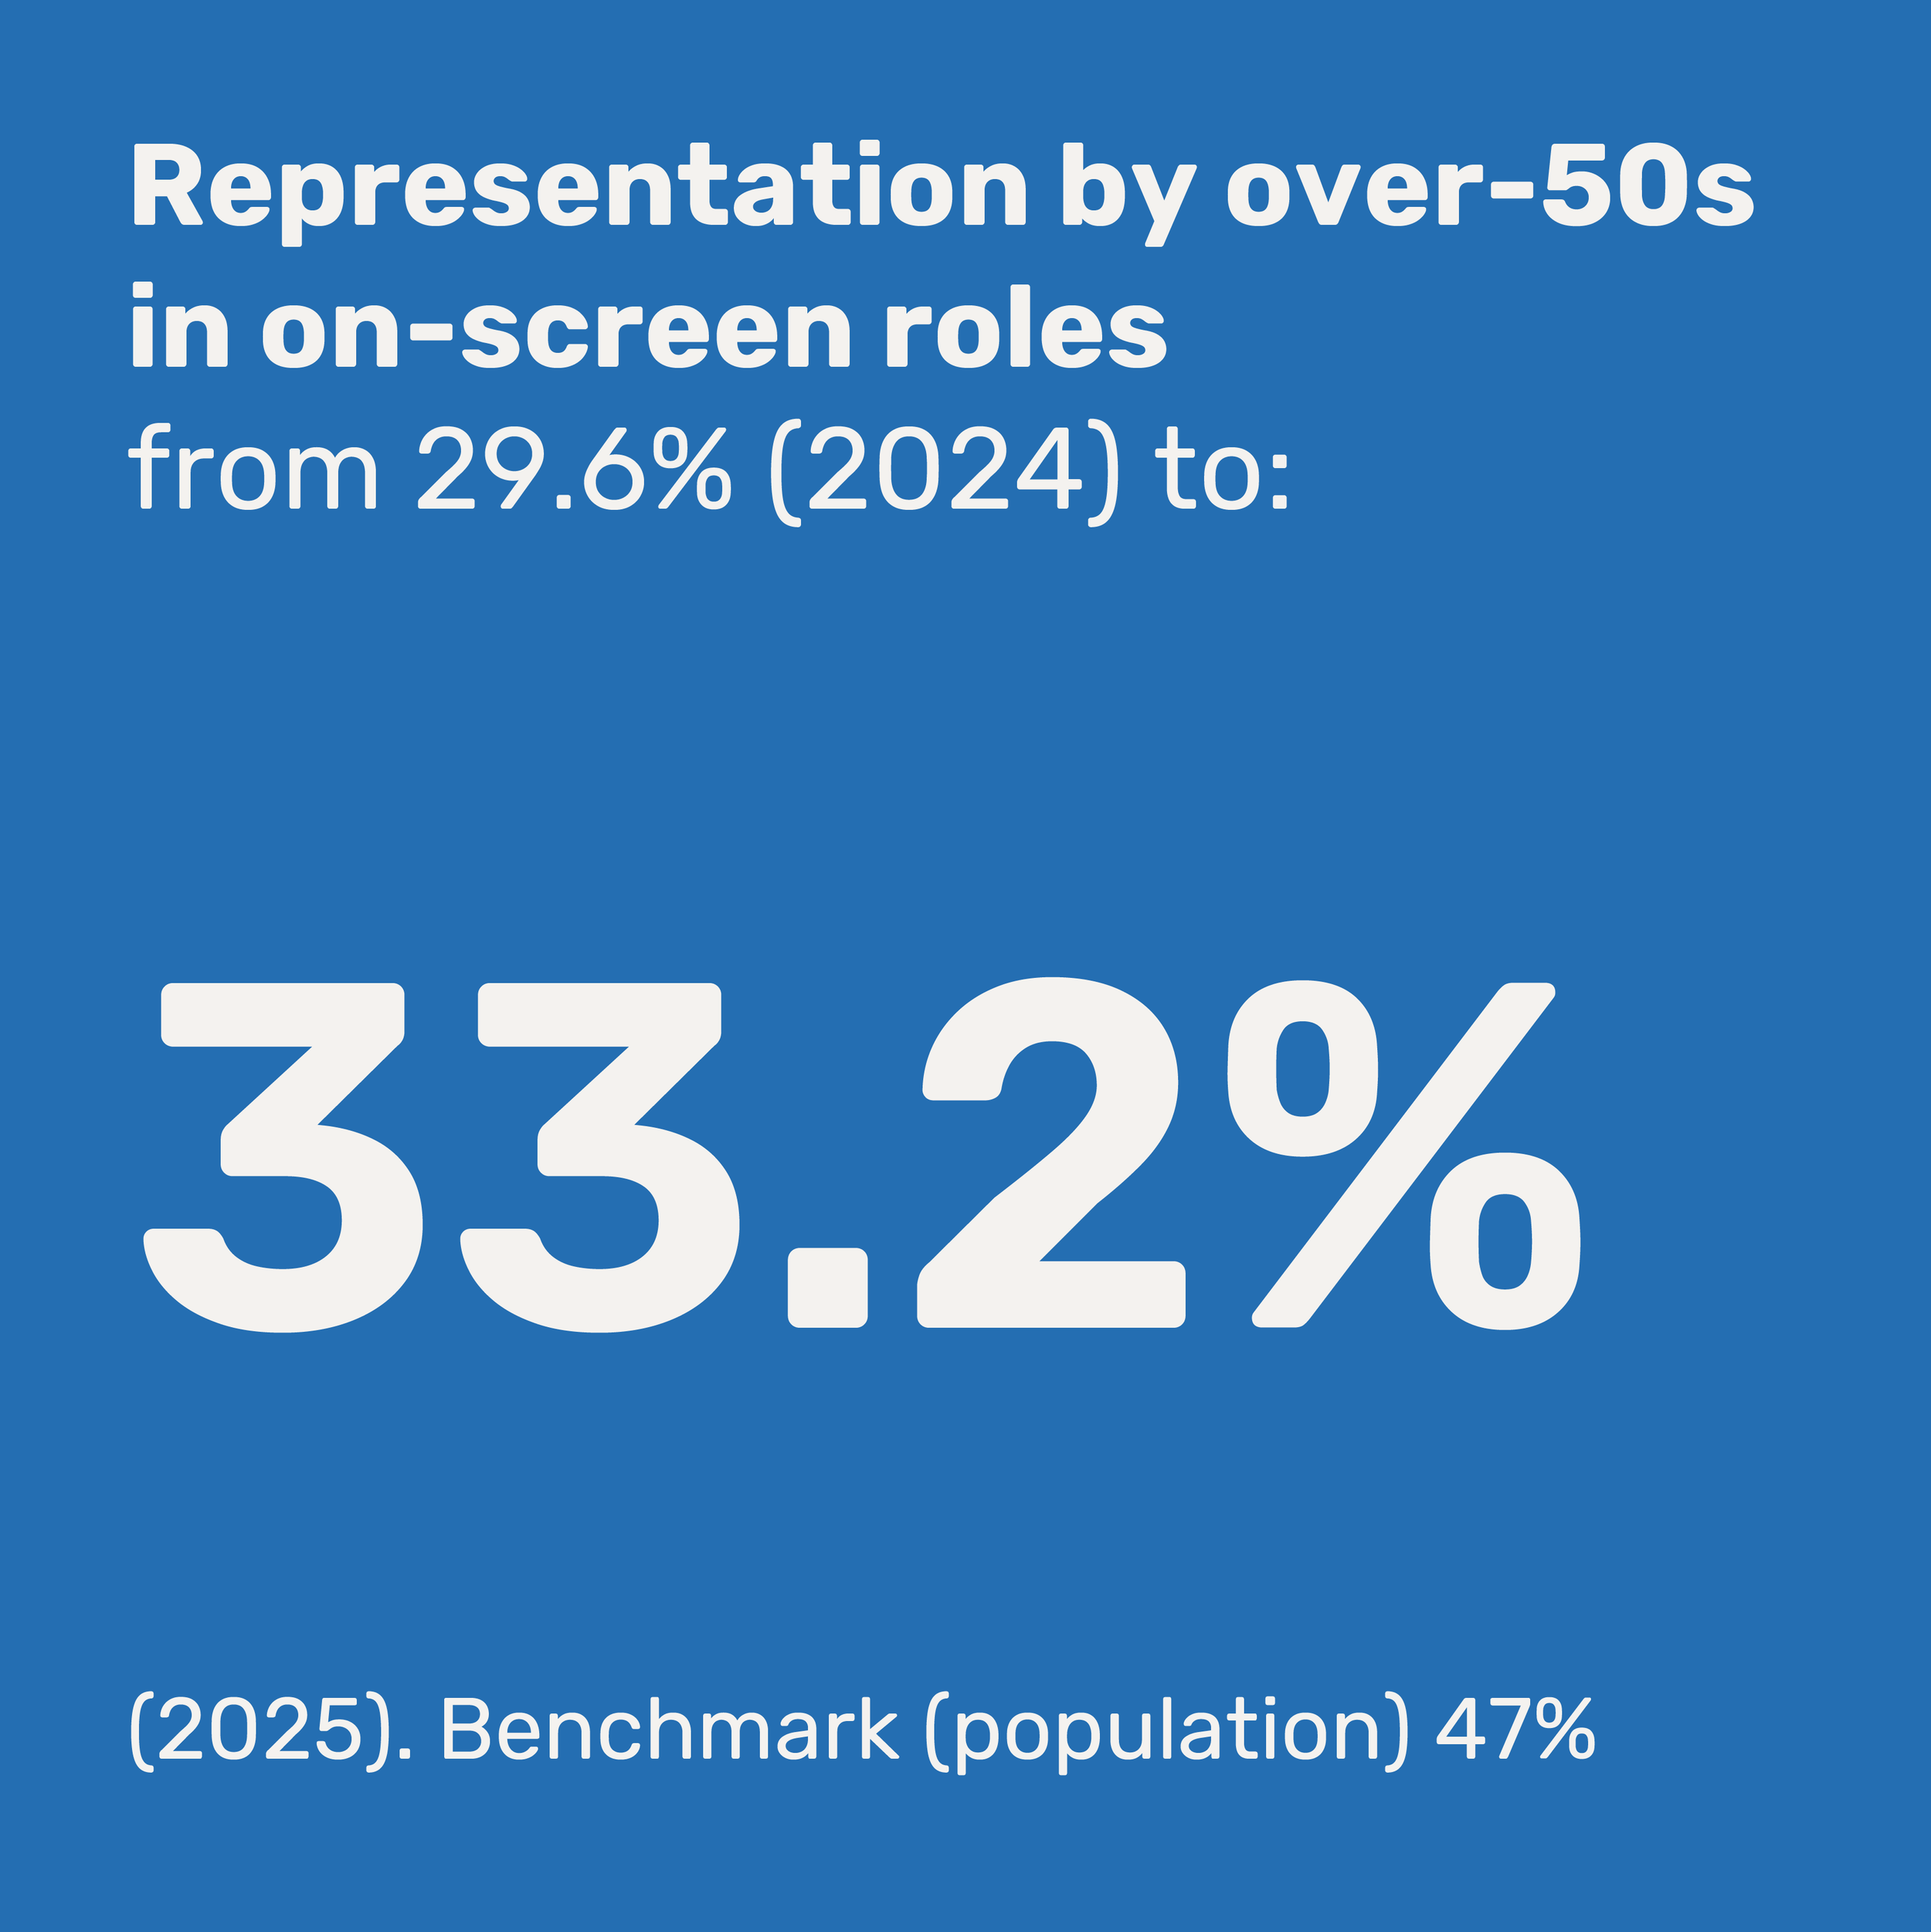
Since 2021 representation by over-50s has been increasing both on and off-screen. Representation remains higher on-screen (33%), which is low compared to national population estimates (47% Annual Population Survey). Off-screen, over-50s now make 28% of contributions, almost on a par with national workforce estimates (29.1% Labour Force Survey).
Genres
Comedy has the highest proportion of contributions by over-50s with around half of all contributions by cast and crew coming from this age group.
Off-screen, over-50s are represented at the lowest levels in Current Affairs (16%) and Factual programmes (22%). On-screen, over-50s have least representation on Children’s programmes (13%).
Off-screen
Over-50s continue to be best represented in the senior roles of Head of Production (68%) and Executive Producer (56%) but remain under-represented in other senior roles such as Producer Director (16%) and Producer (21%).
Elsewhere across production, over-50s dominate Costume and Wardrobe roles (69%) but are under-represented in Visual Effects (25%) and Set Design (22%) roles.
On-screen
Over-50s are much more highly represented on non-scripted (36%) shows than scripted (21%) ones, but representation is higher in Contributor (37%) roles than in Presenter (27%) roles. On scripted shows, over-50s make far fewer contributions as Lead Actor (13%) than in Supporting Actor (23%) or Background Actor (32%) roles.
Disability
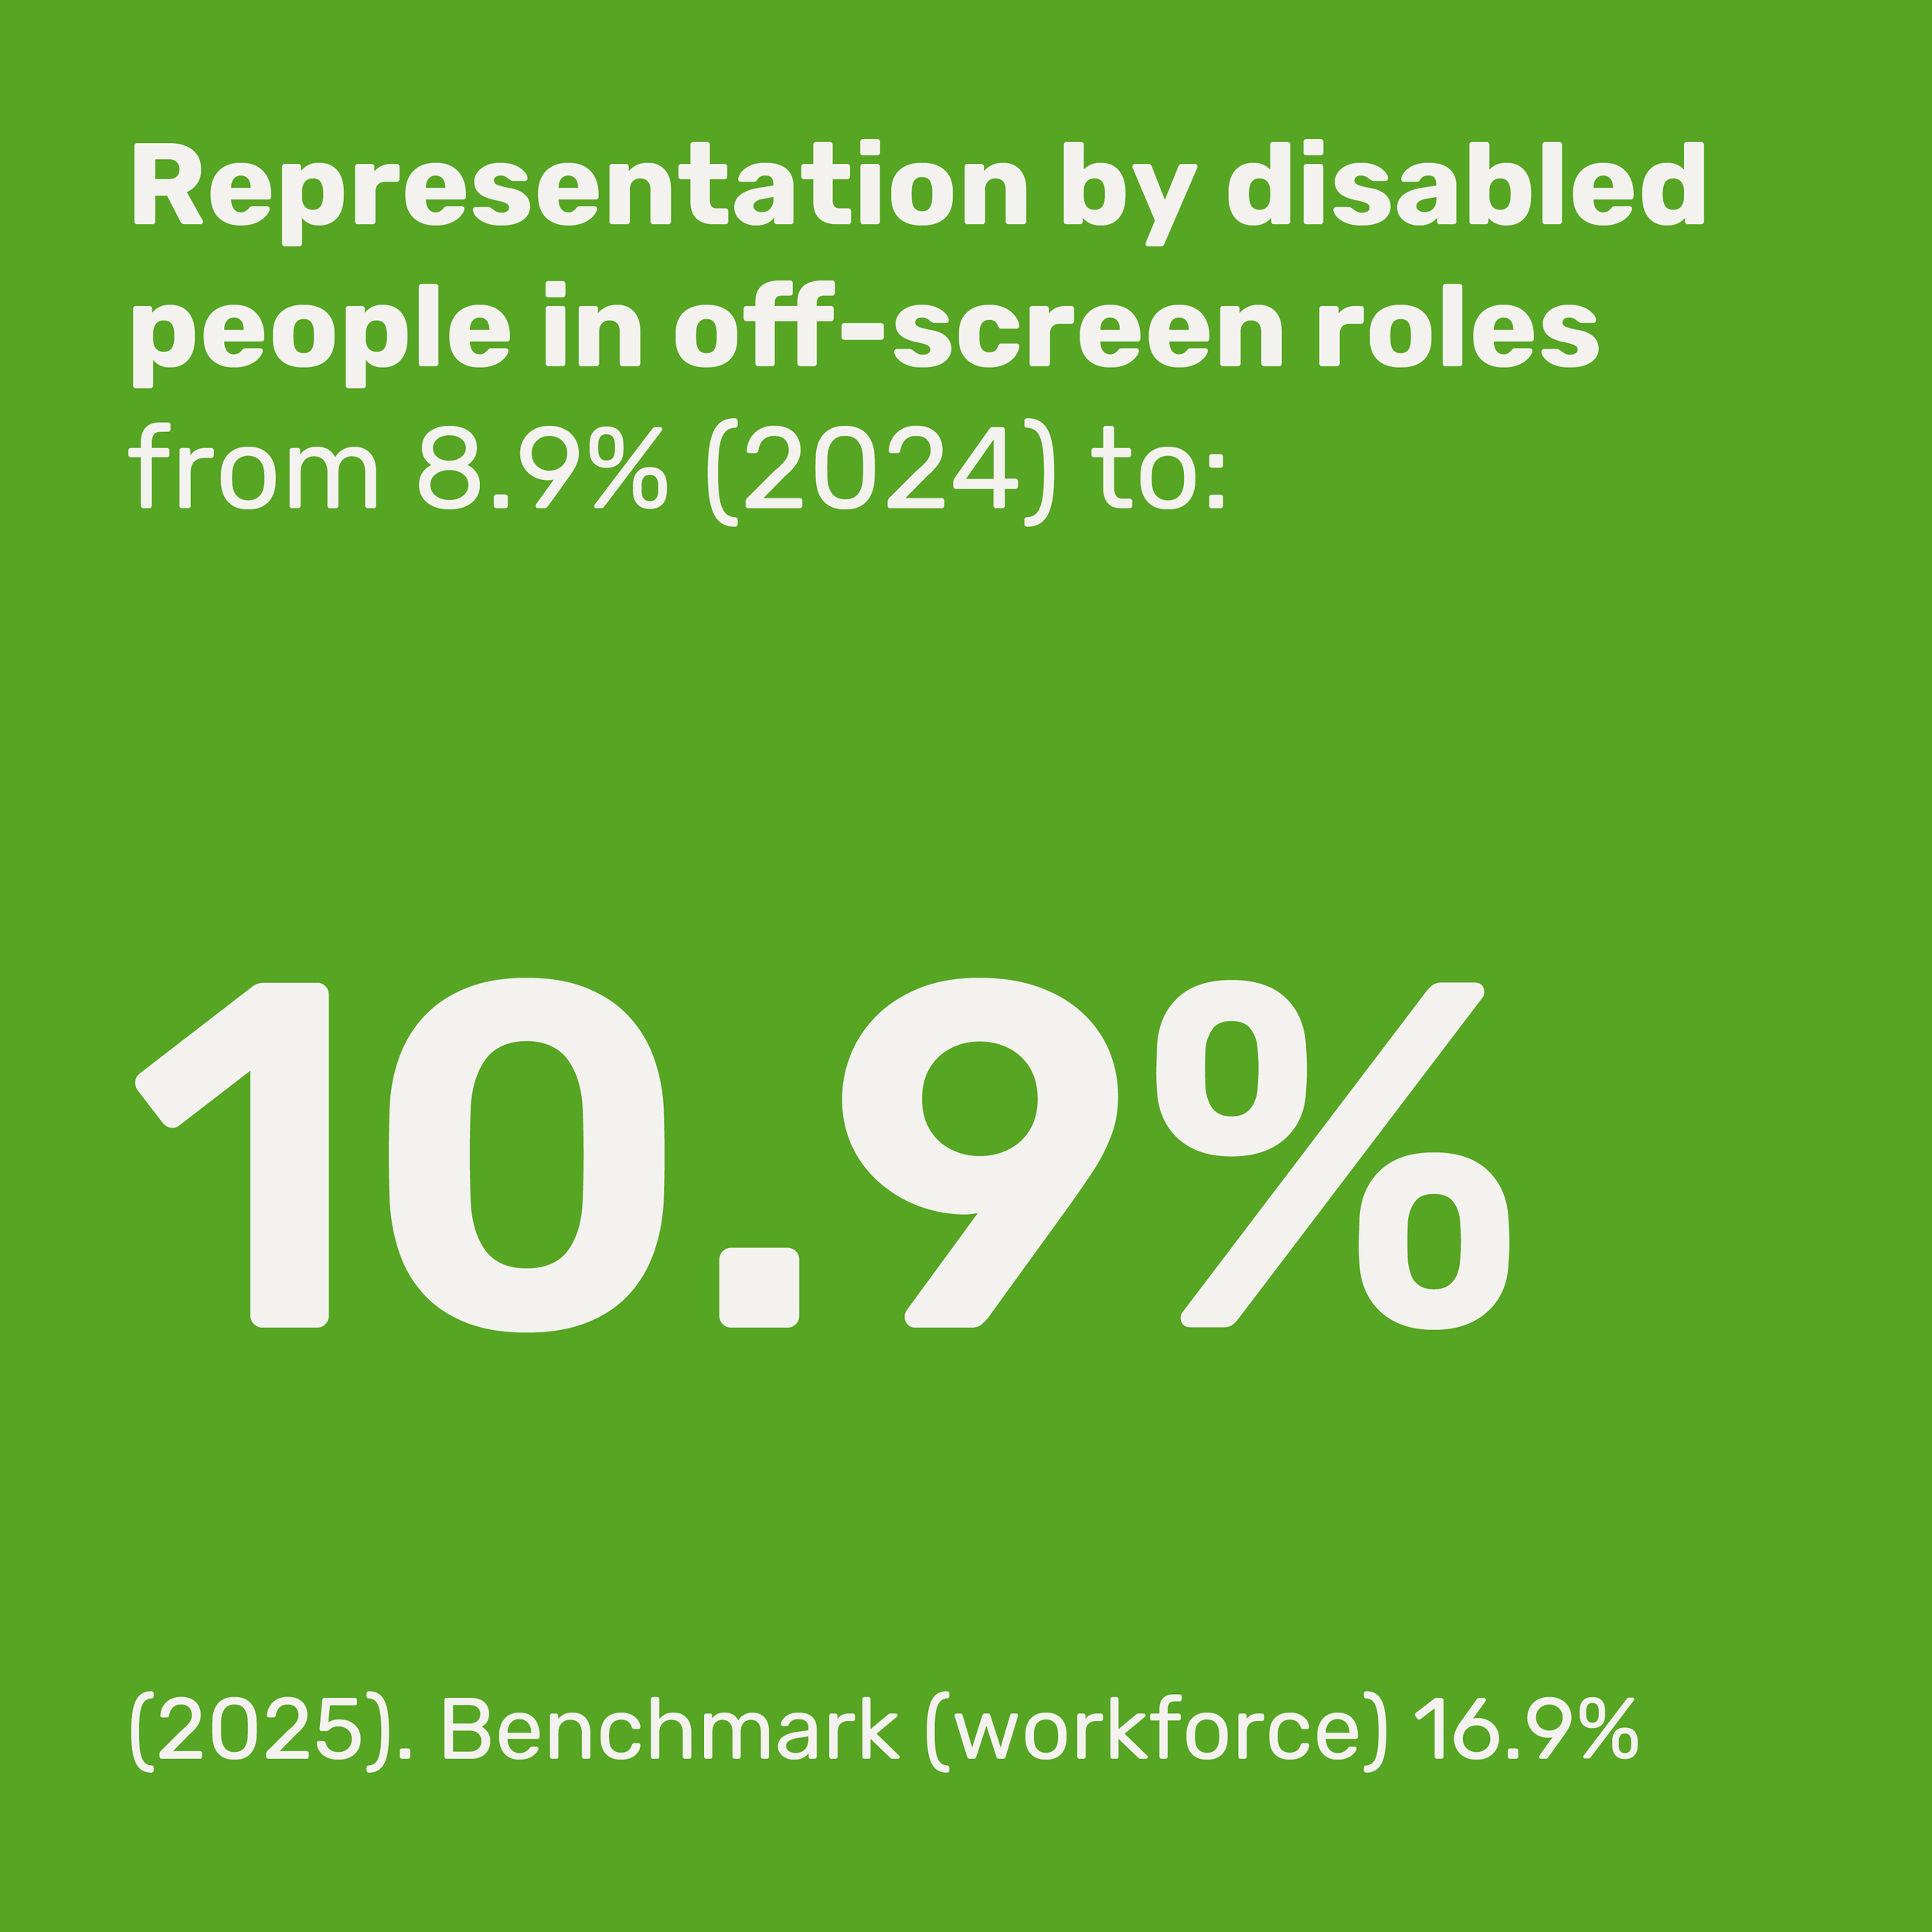
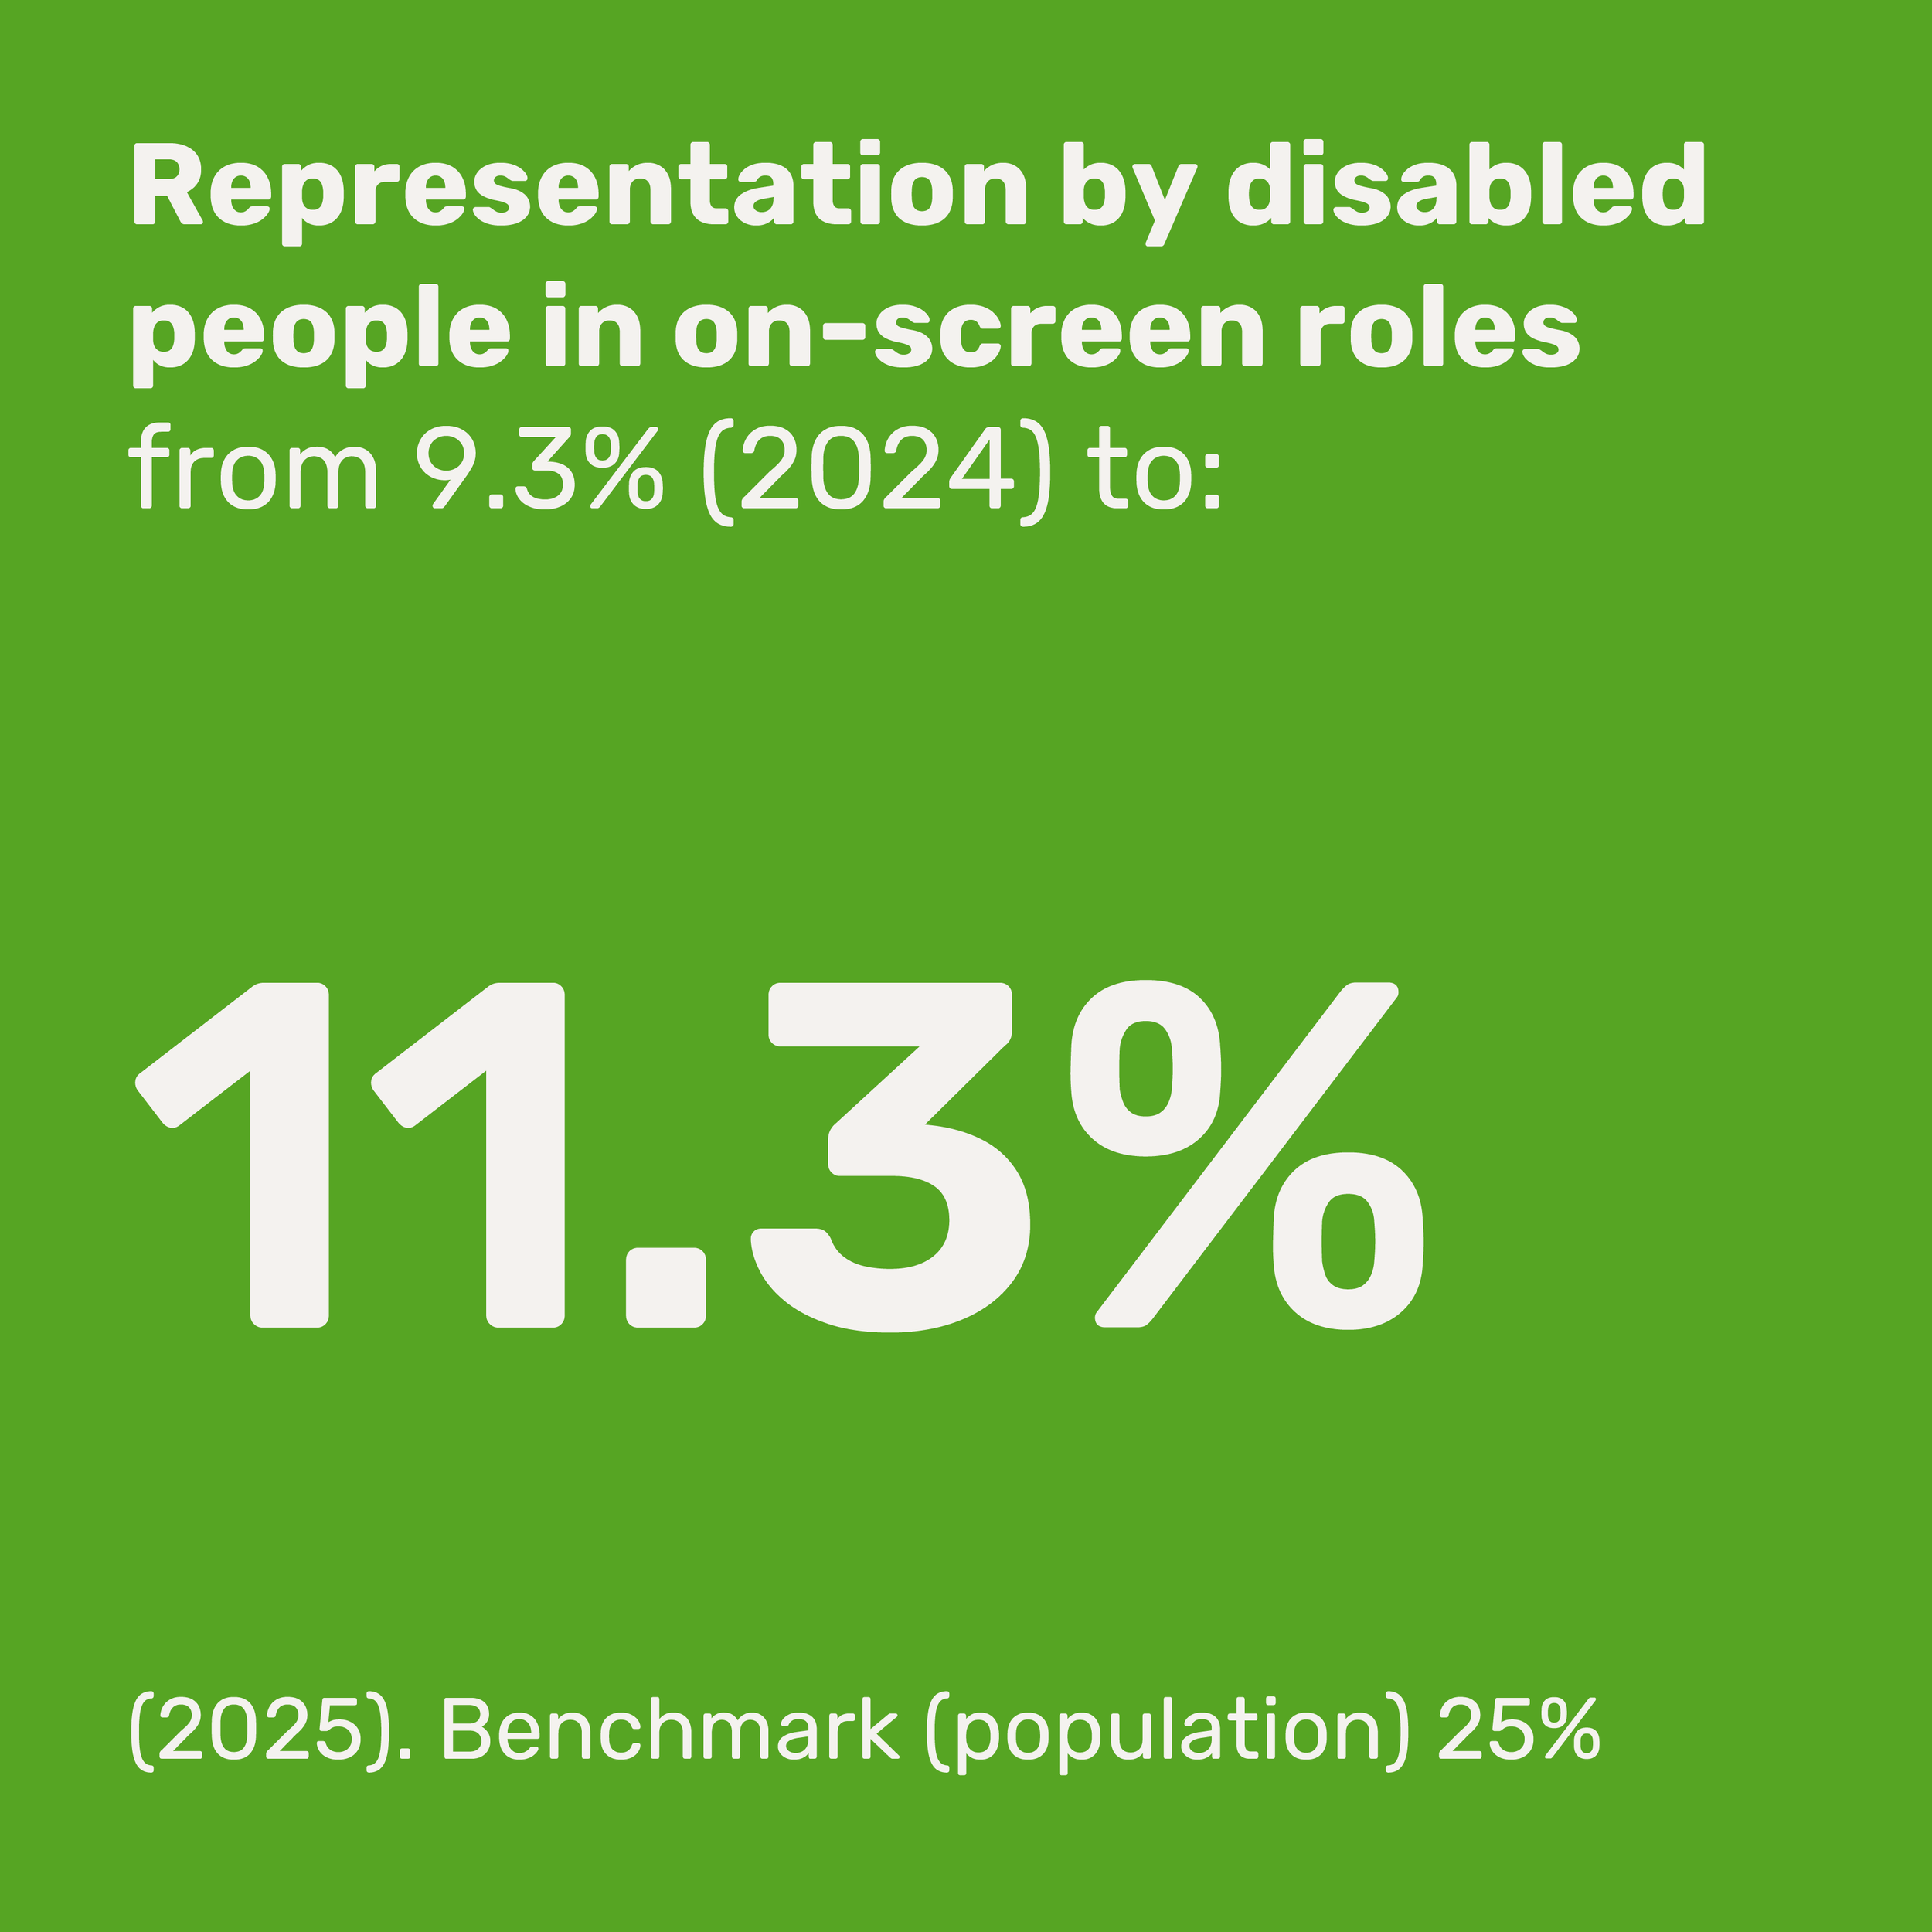
Disabled people remain under-represented in the industry compared to their overall representation in the population (25%; Family Resource Survey 2023-24) and national workforce (16.9%; Labour Force Survey 2025). However, both on and off-screen, there has been steady progress in representation year-on-year. The gap between on and off-screen representation has also narrowed since 2022, and disabled people now make around 11% of all programme contributions.
Genres
Off-screen representation by disabled people has been increasing across all genres except for Current Affairs where representation is lowest (8%).
Between 2021 and 2025 on-screen representation has increased across all genres except Children’s and Current Affairs.
Off-screen
Disabled people are slightly higher represented in non-senior than in senior roles. Across senior roles, disabled people are best represented as Head of Production (16%) but worst represented in Executive Producer (8%) and Commissioning Editor (9%) roles.
Disabled people are represented in line with national workforce estimates in Visual Effects roles (17%). Representation remains very low in many other production roles, especially Craft and Technical (5%) and Sound (6%).
On-screen
Disabled representation is at the same level in scripted and non-scripted roles (11%).
On scripted programmes, disabled people are better represented in Supporting Actor (11%) rather than Lead Actor (9%) roles. However, representation of disabled people in Lead Actor roles is now the highest it has ever been.
On non-scripted programmes, disabled people are currently better represented as Presenters (12%) than as Contributors (10%), but the proportion of contributions made by disabled Presenters has been declining.
Ethnicity
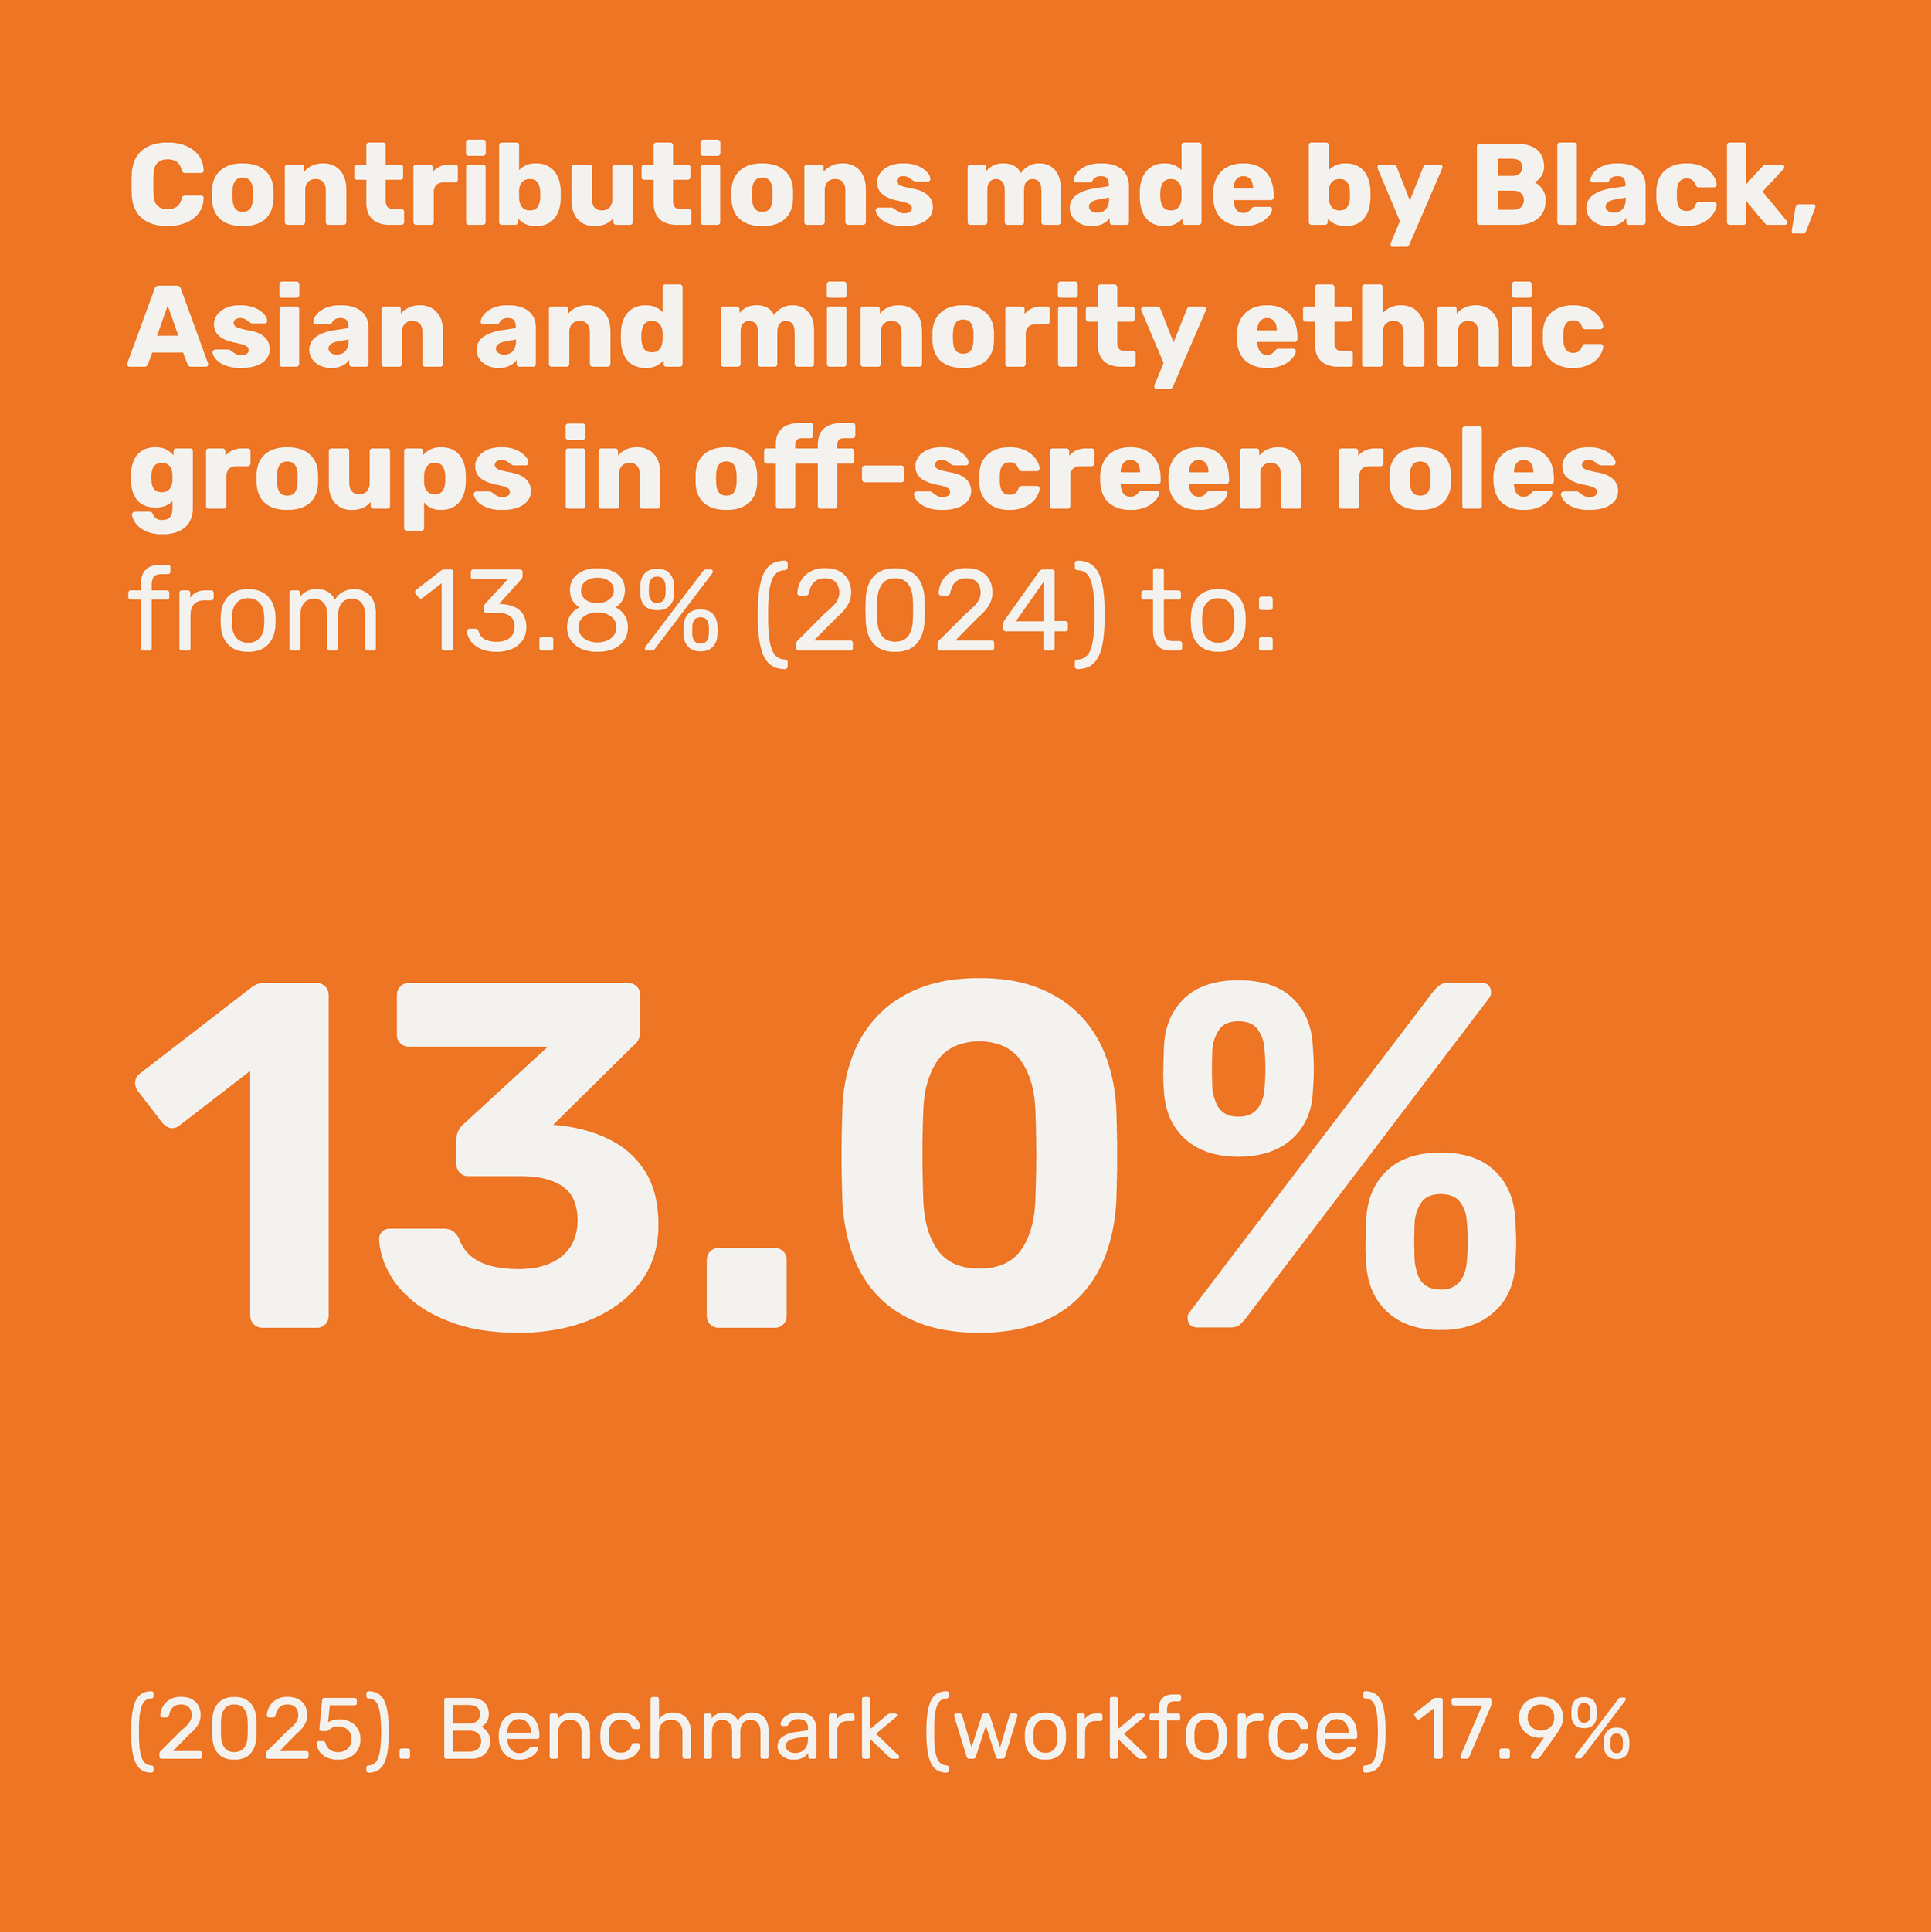
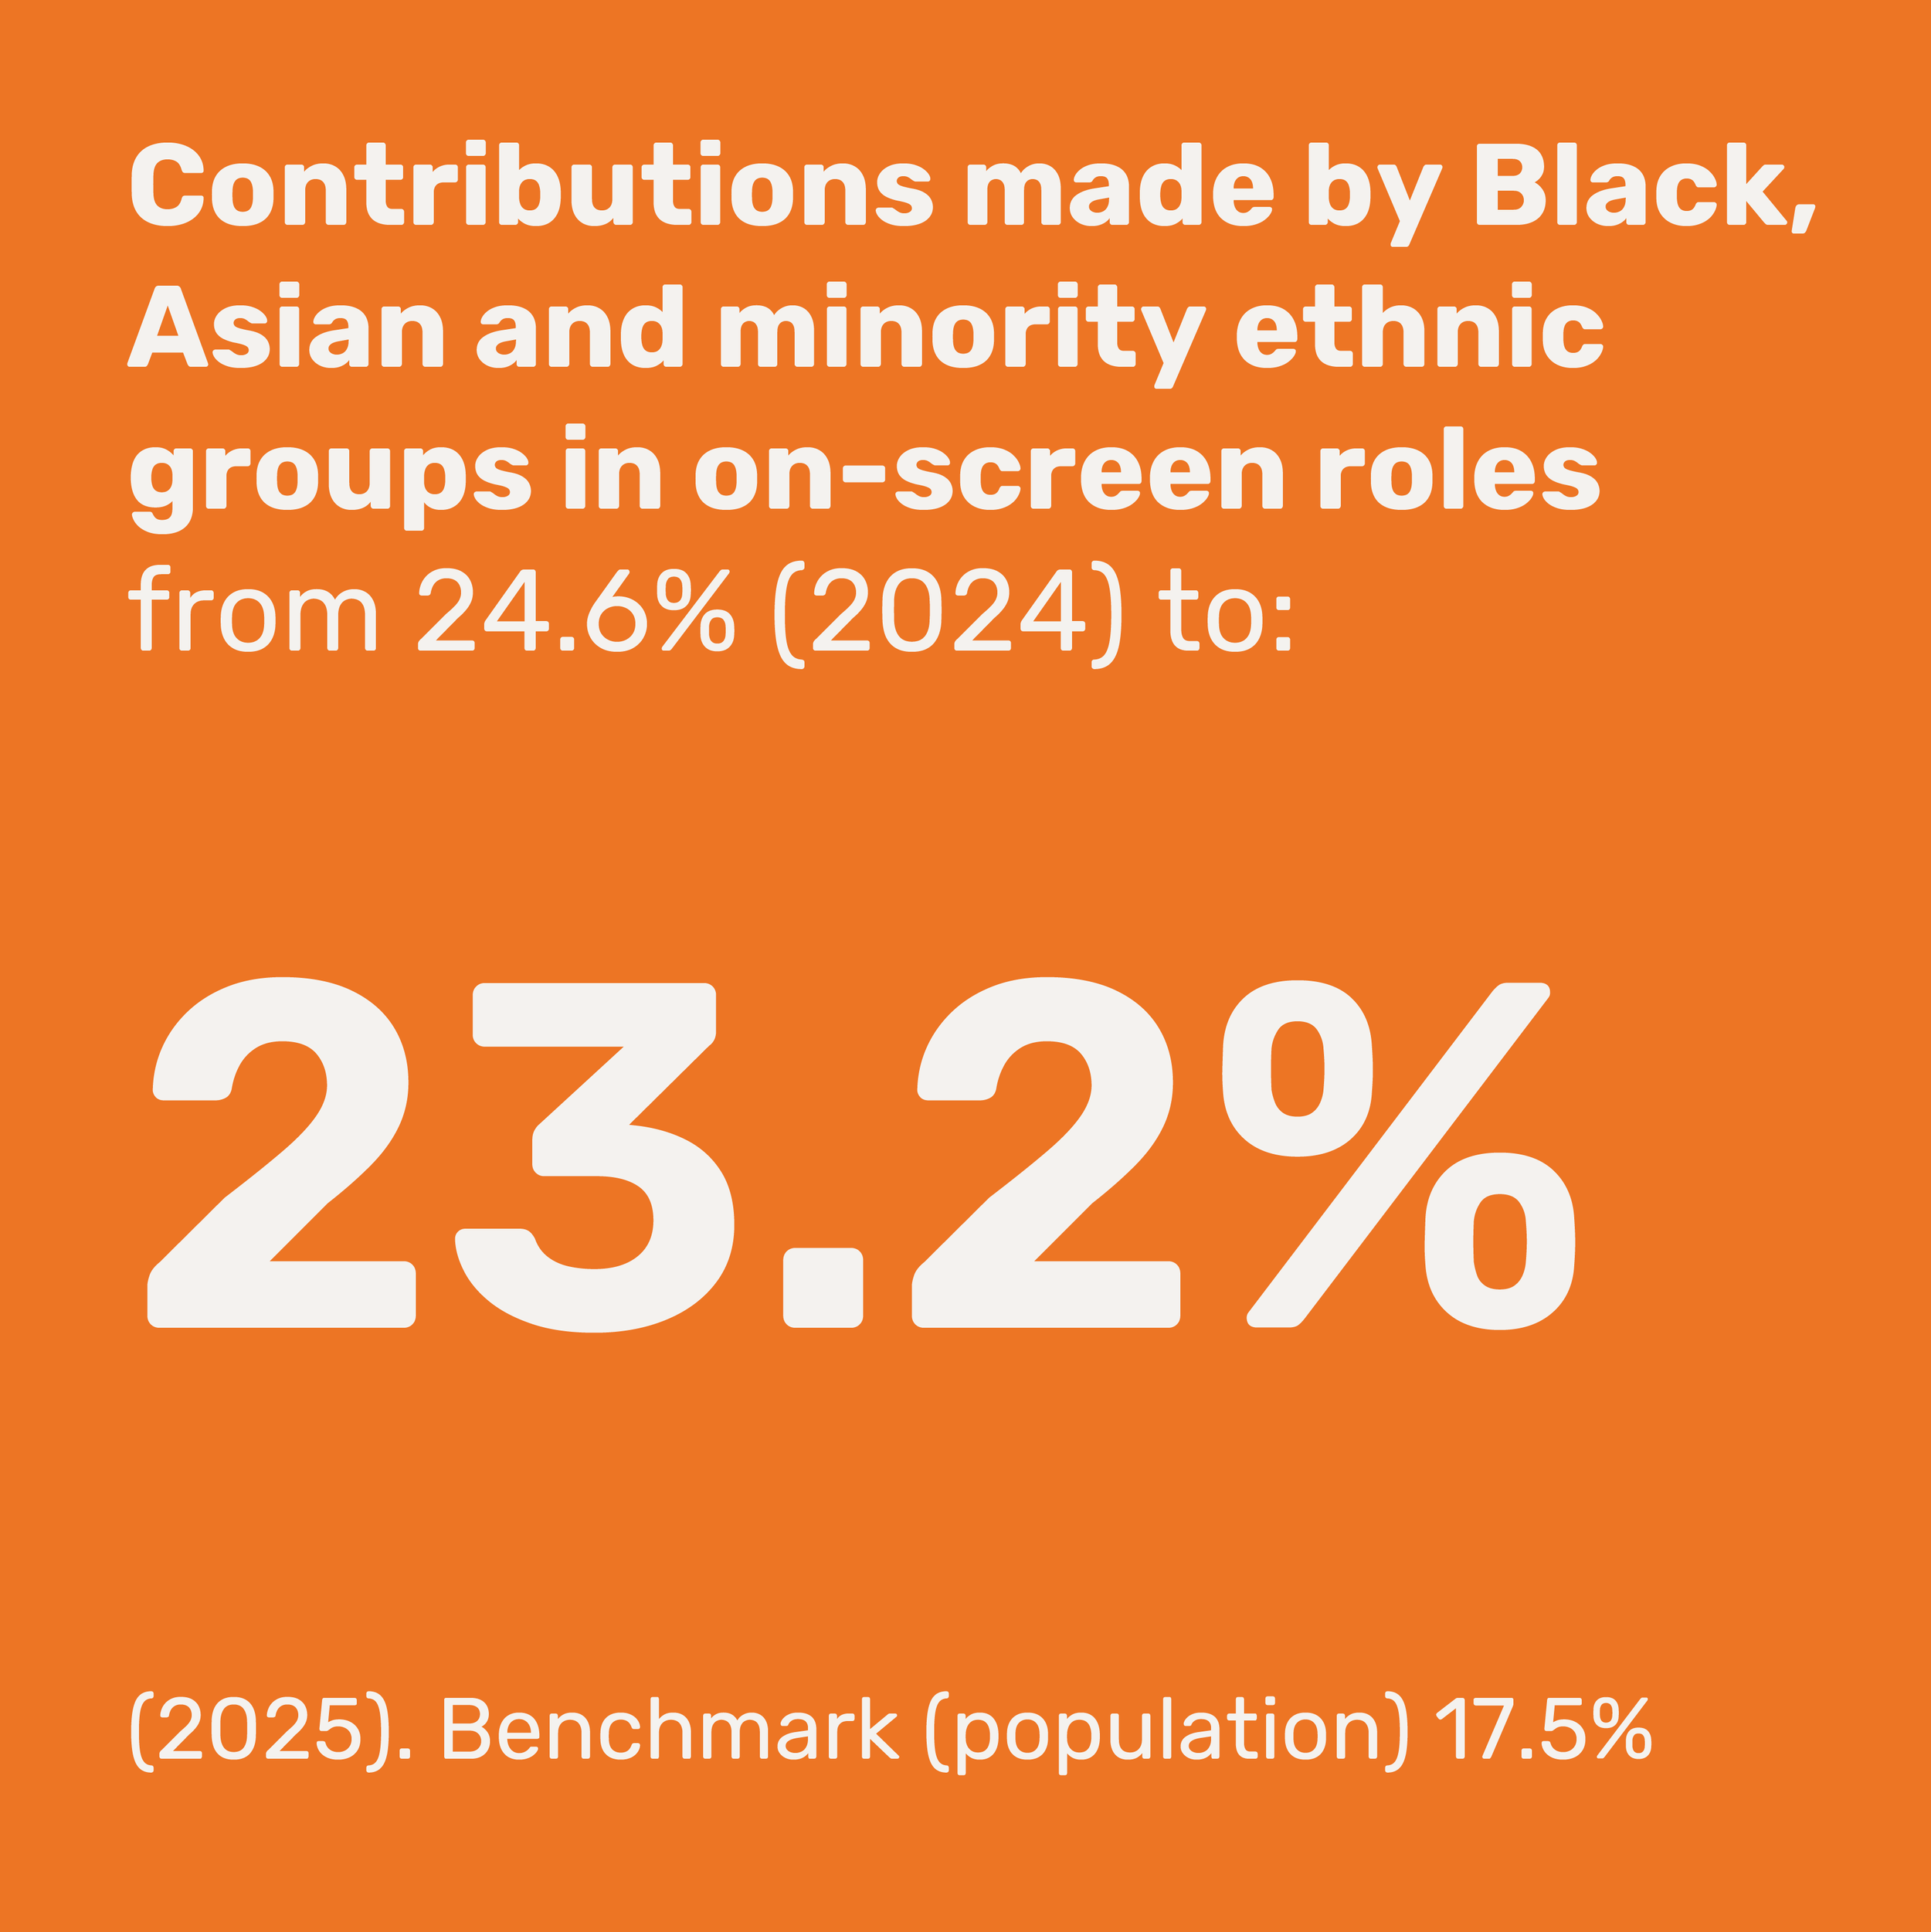
The proportion of contributions made by Black, Asian and minority ethnic groups decreased in 2025 both on and off-screen. Despite a few years of increased representation across cast and crew between 2021 and 2024, off-screen representation is now the same as it was in 2021.
Genres
While Black, Asian and minority ethnic groups are best represented in Current Affairs (21%) programmes off-screen, it is Drama (18%) where the most sustained progress has been made over the past few years.
On-screen, representation remains highest on Children’s and Drama programmes (both 35%) and lowest on Factual (17%) and Lifestyle (14%) programmes.
Off-screen
People from Black, Asian and minority ethnic groups remain under-represented in off-screen roles, making 13% of contributions in 2025 despite making up 17.9% of the national workforce (Labour Force Survey).
After White people, those from Mixed and multiple ethnic groups continue to be represented at the highest level off-screen (6%), and at a higher rate than in the national workforce (1.8%).
Representation by people from East Asian and South Asian groups (3.1% in total) has changed very little since Diamond monitoring started, and remains very low, below national workforce rates (7.2%).
The proportion of contributions made by Black people has decreased from 4% in 2022 to 2.7% in 2025 and remains below the national workforce benchmark (5.2%).
On-screen
Despite continued under-representation off-screen, Black, Asian and minority ethnic groups are still well represented on-screen, making 23% of contributions in 2025. This is slightly higher than national population estimates (17.5%; Annual Population Survey). Representation is much higher in scripted (36%) rather than in non-scripted (20%) roles.
Gender
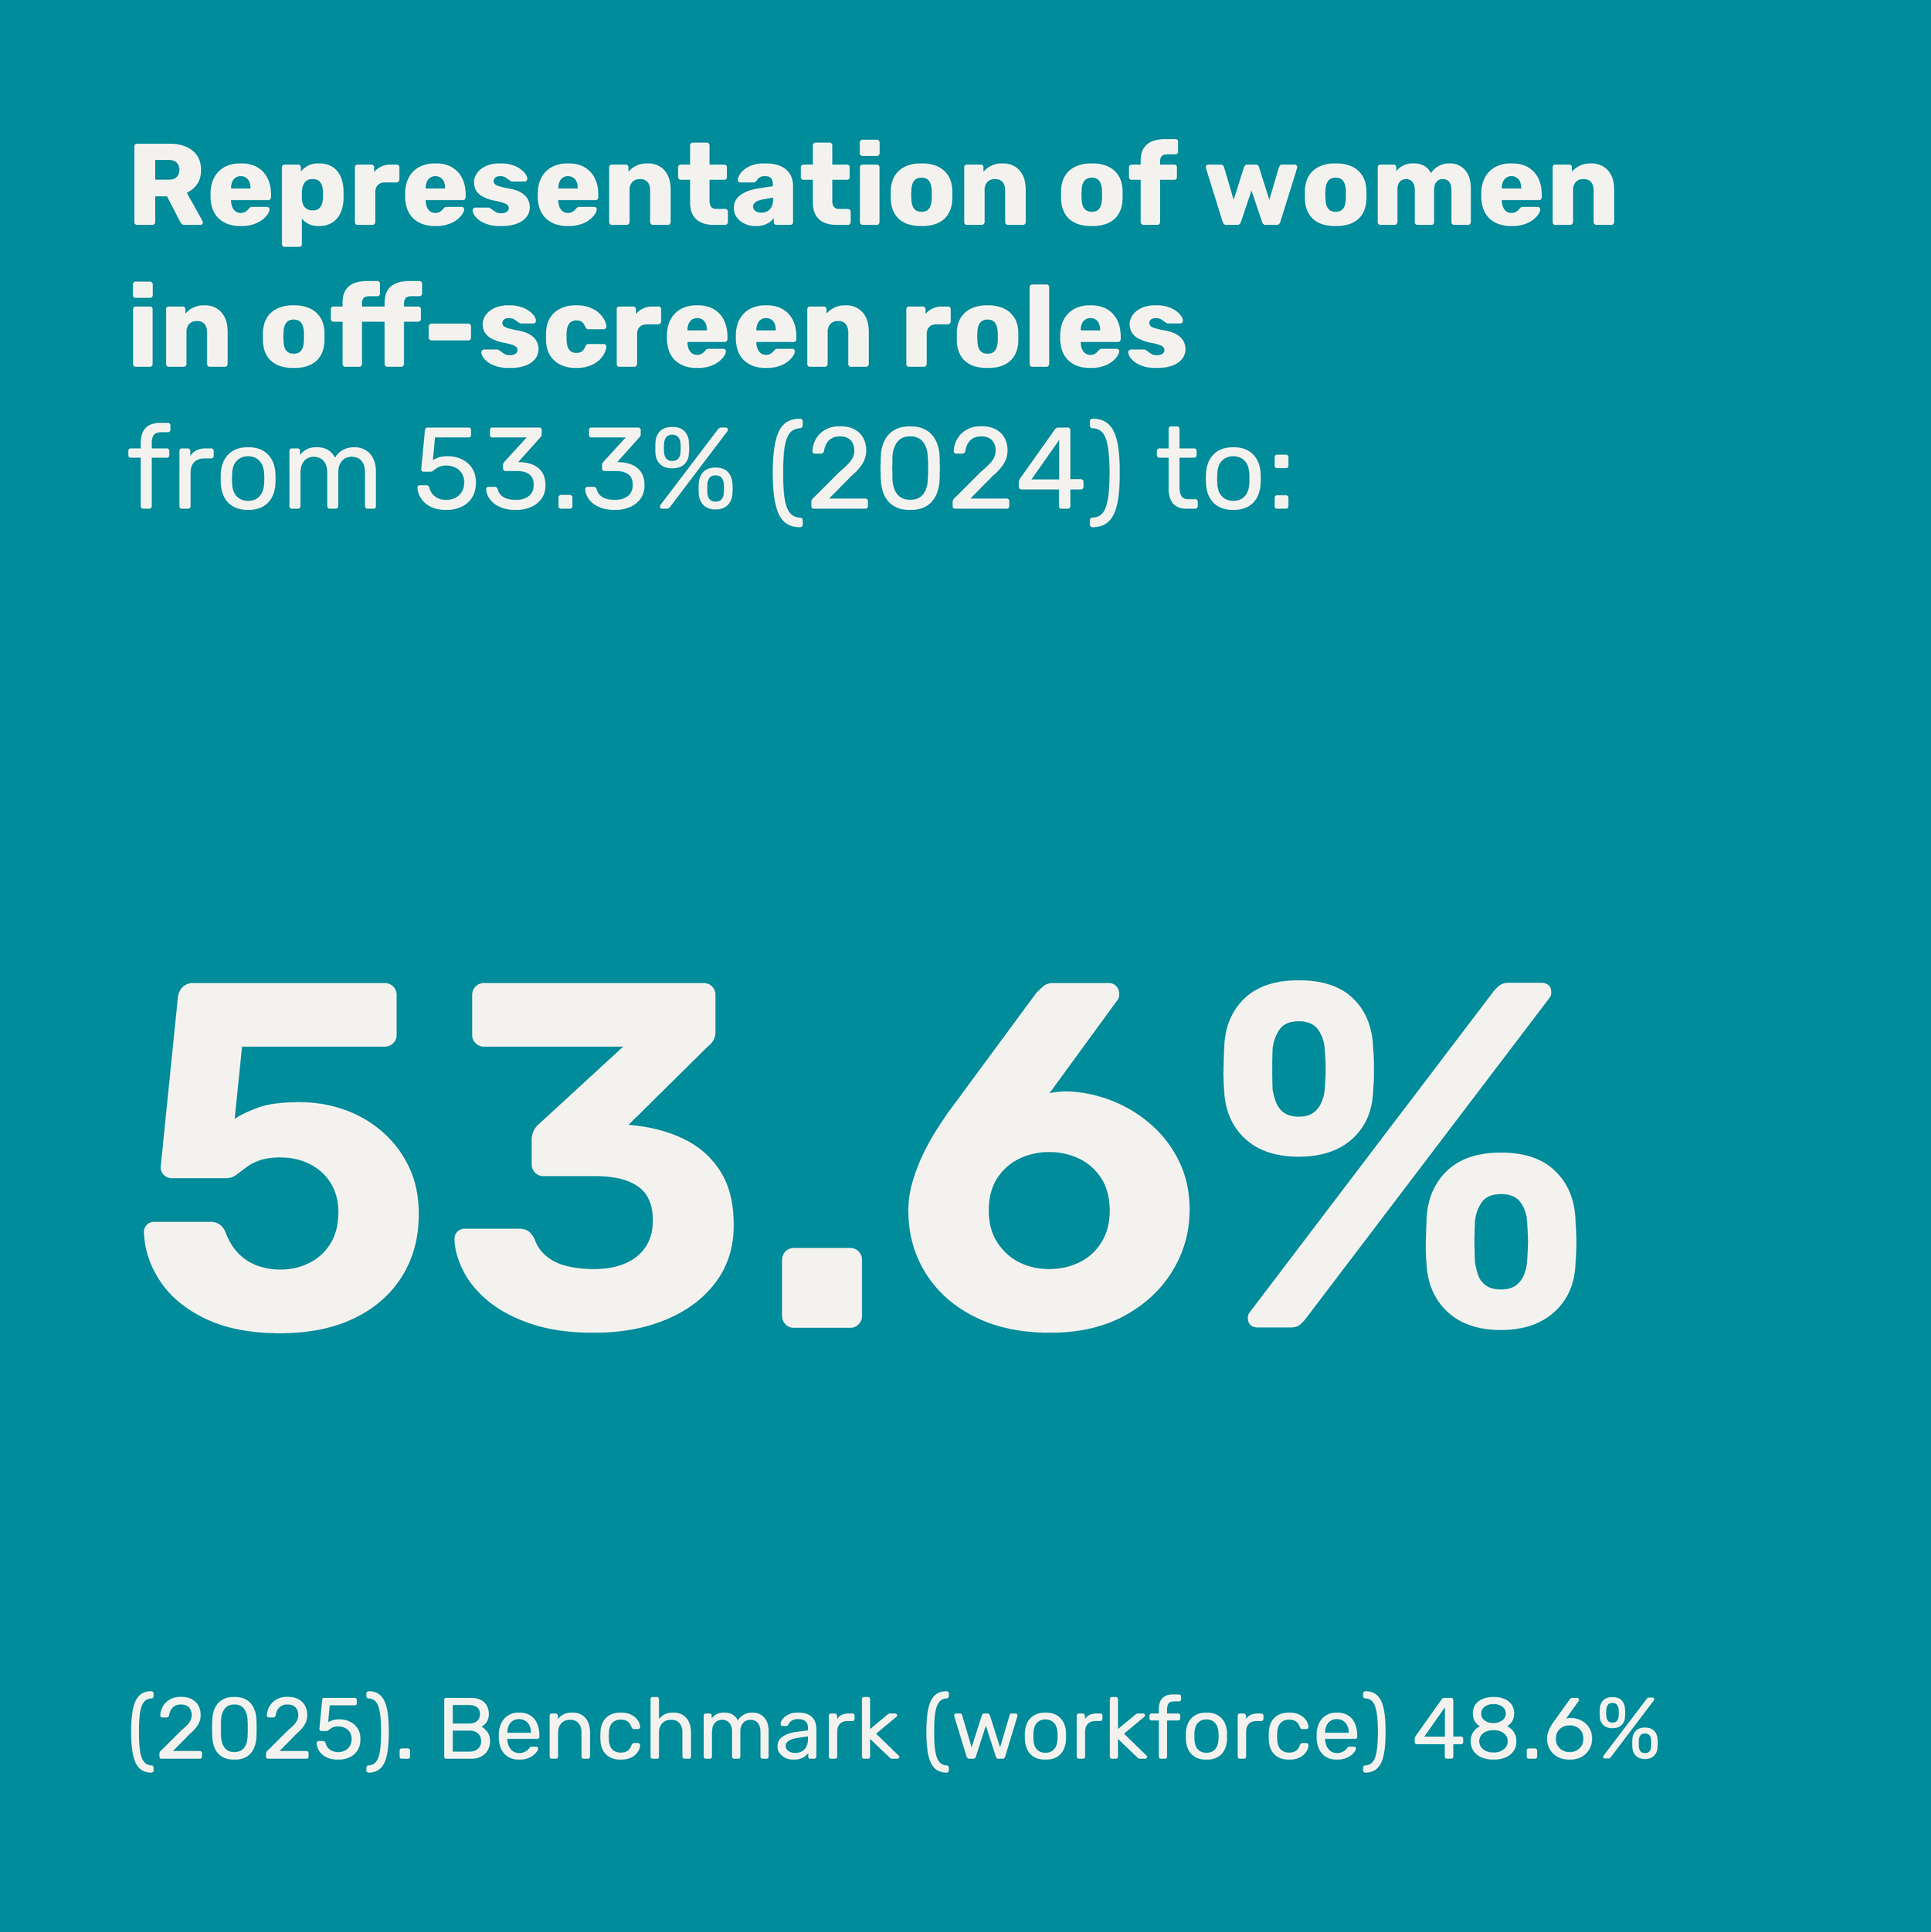
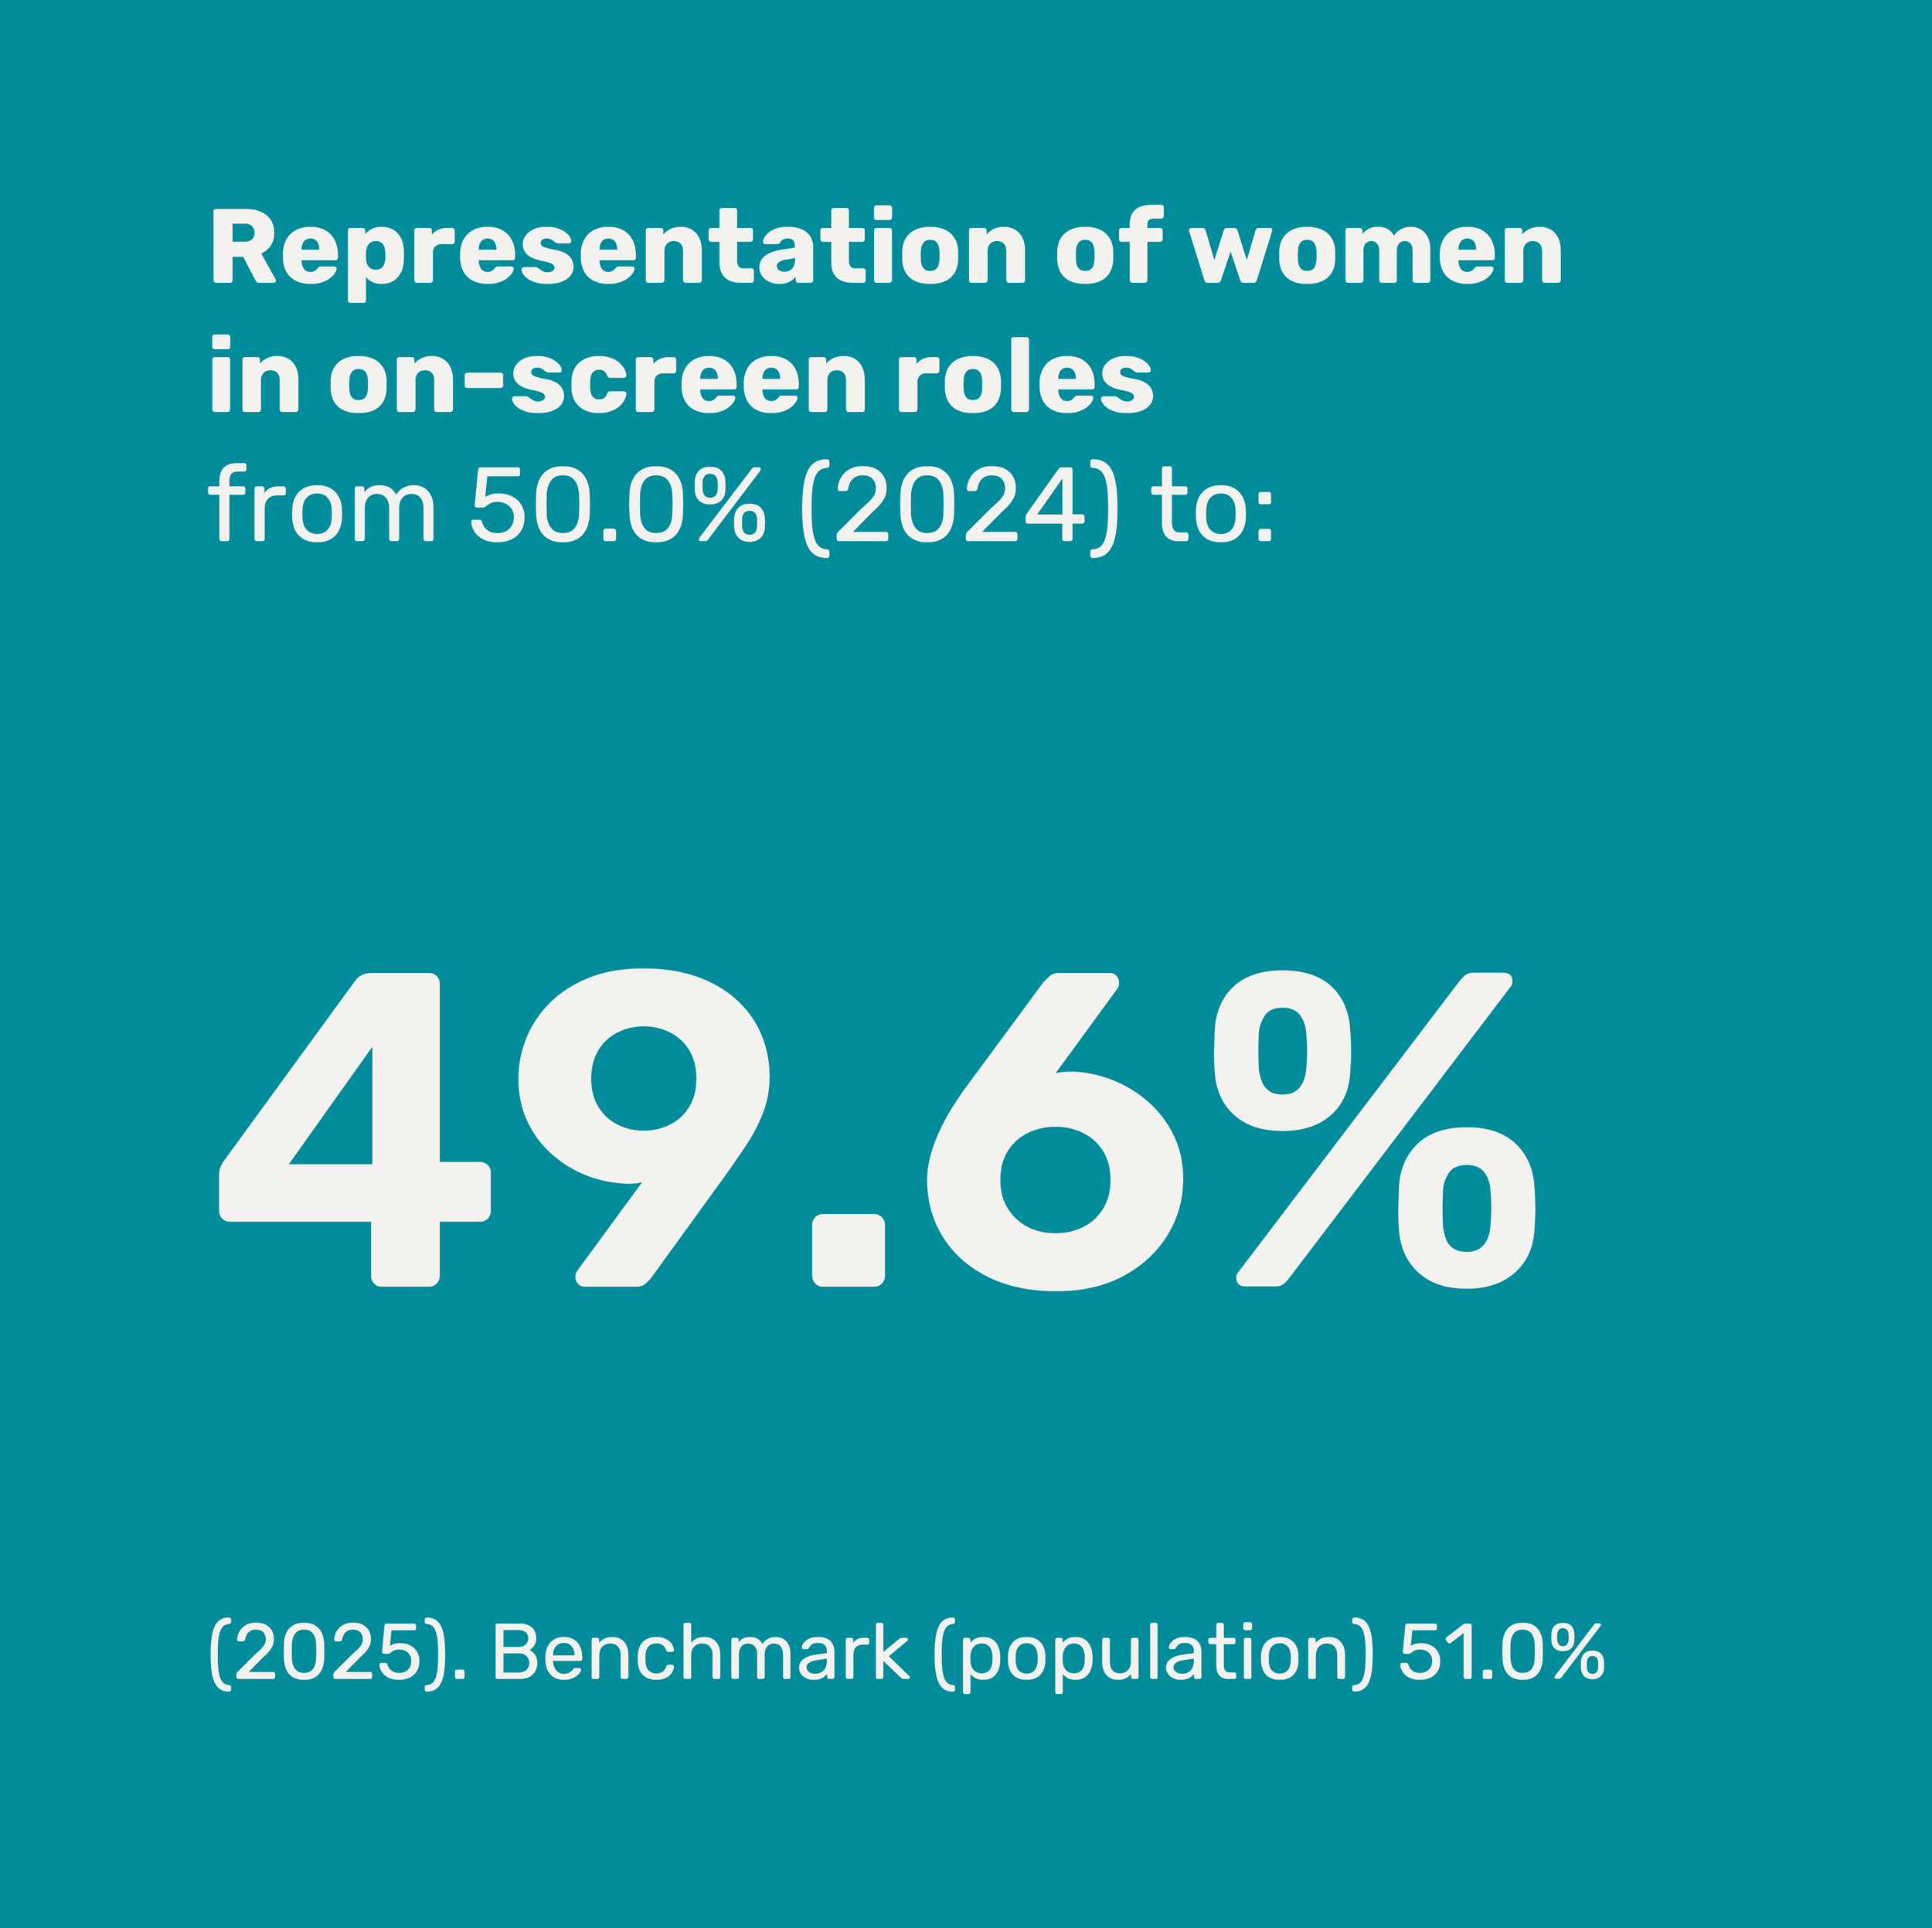
Compared to national workforce estimates (48.6% Labour Force Survey), women remain well represented in off-screen roles (53.6%). However, women are less well represented on-screen. They made 49.6% of on-screen contributions in 2025, a decrease from 52% of contributions in 2021, and slightly lower than population estimates (51% Annual Population Survey).
Genres
Women are least well represented in Comedy programmes, particularly on-screen where they now make just 35% of contributions.
Women are most strongly represented on Current Affairs programmes (60.5% contributions off-screen, 56.3% on-screen).
Off-screen
Overall, women are better represented than men in off-screen roles. However, women continue to be under-represented in many senior roles compared to their prevalence in the national workforce (48.6% Labour Force Survey).
A wide gender divide continues in many production roles with many jobs being dominated by one gender. For example, 95% of Costume and Wardrobe contributions come from women, and 86% of Lighting contributions are made by men.
On-screen
Women and men are represented at equal levels on-screen, and in most on-screen role types. However, women are less well represented in non-scripted roles (49%) compared to scripted roles (52%).
Sexuality
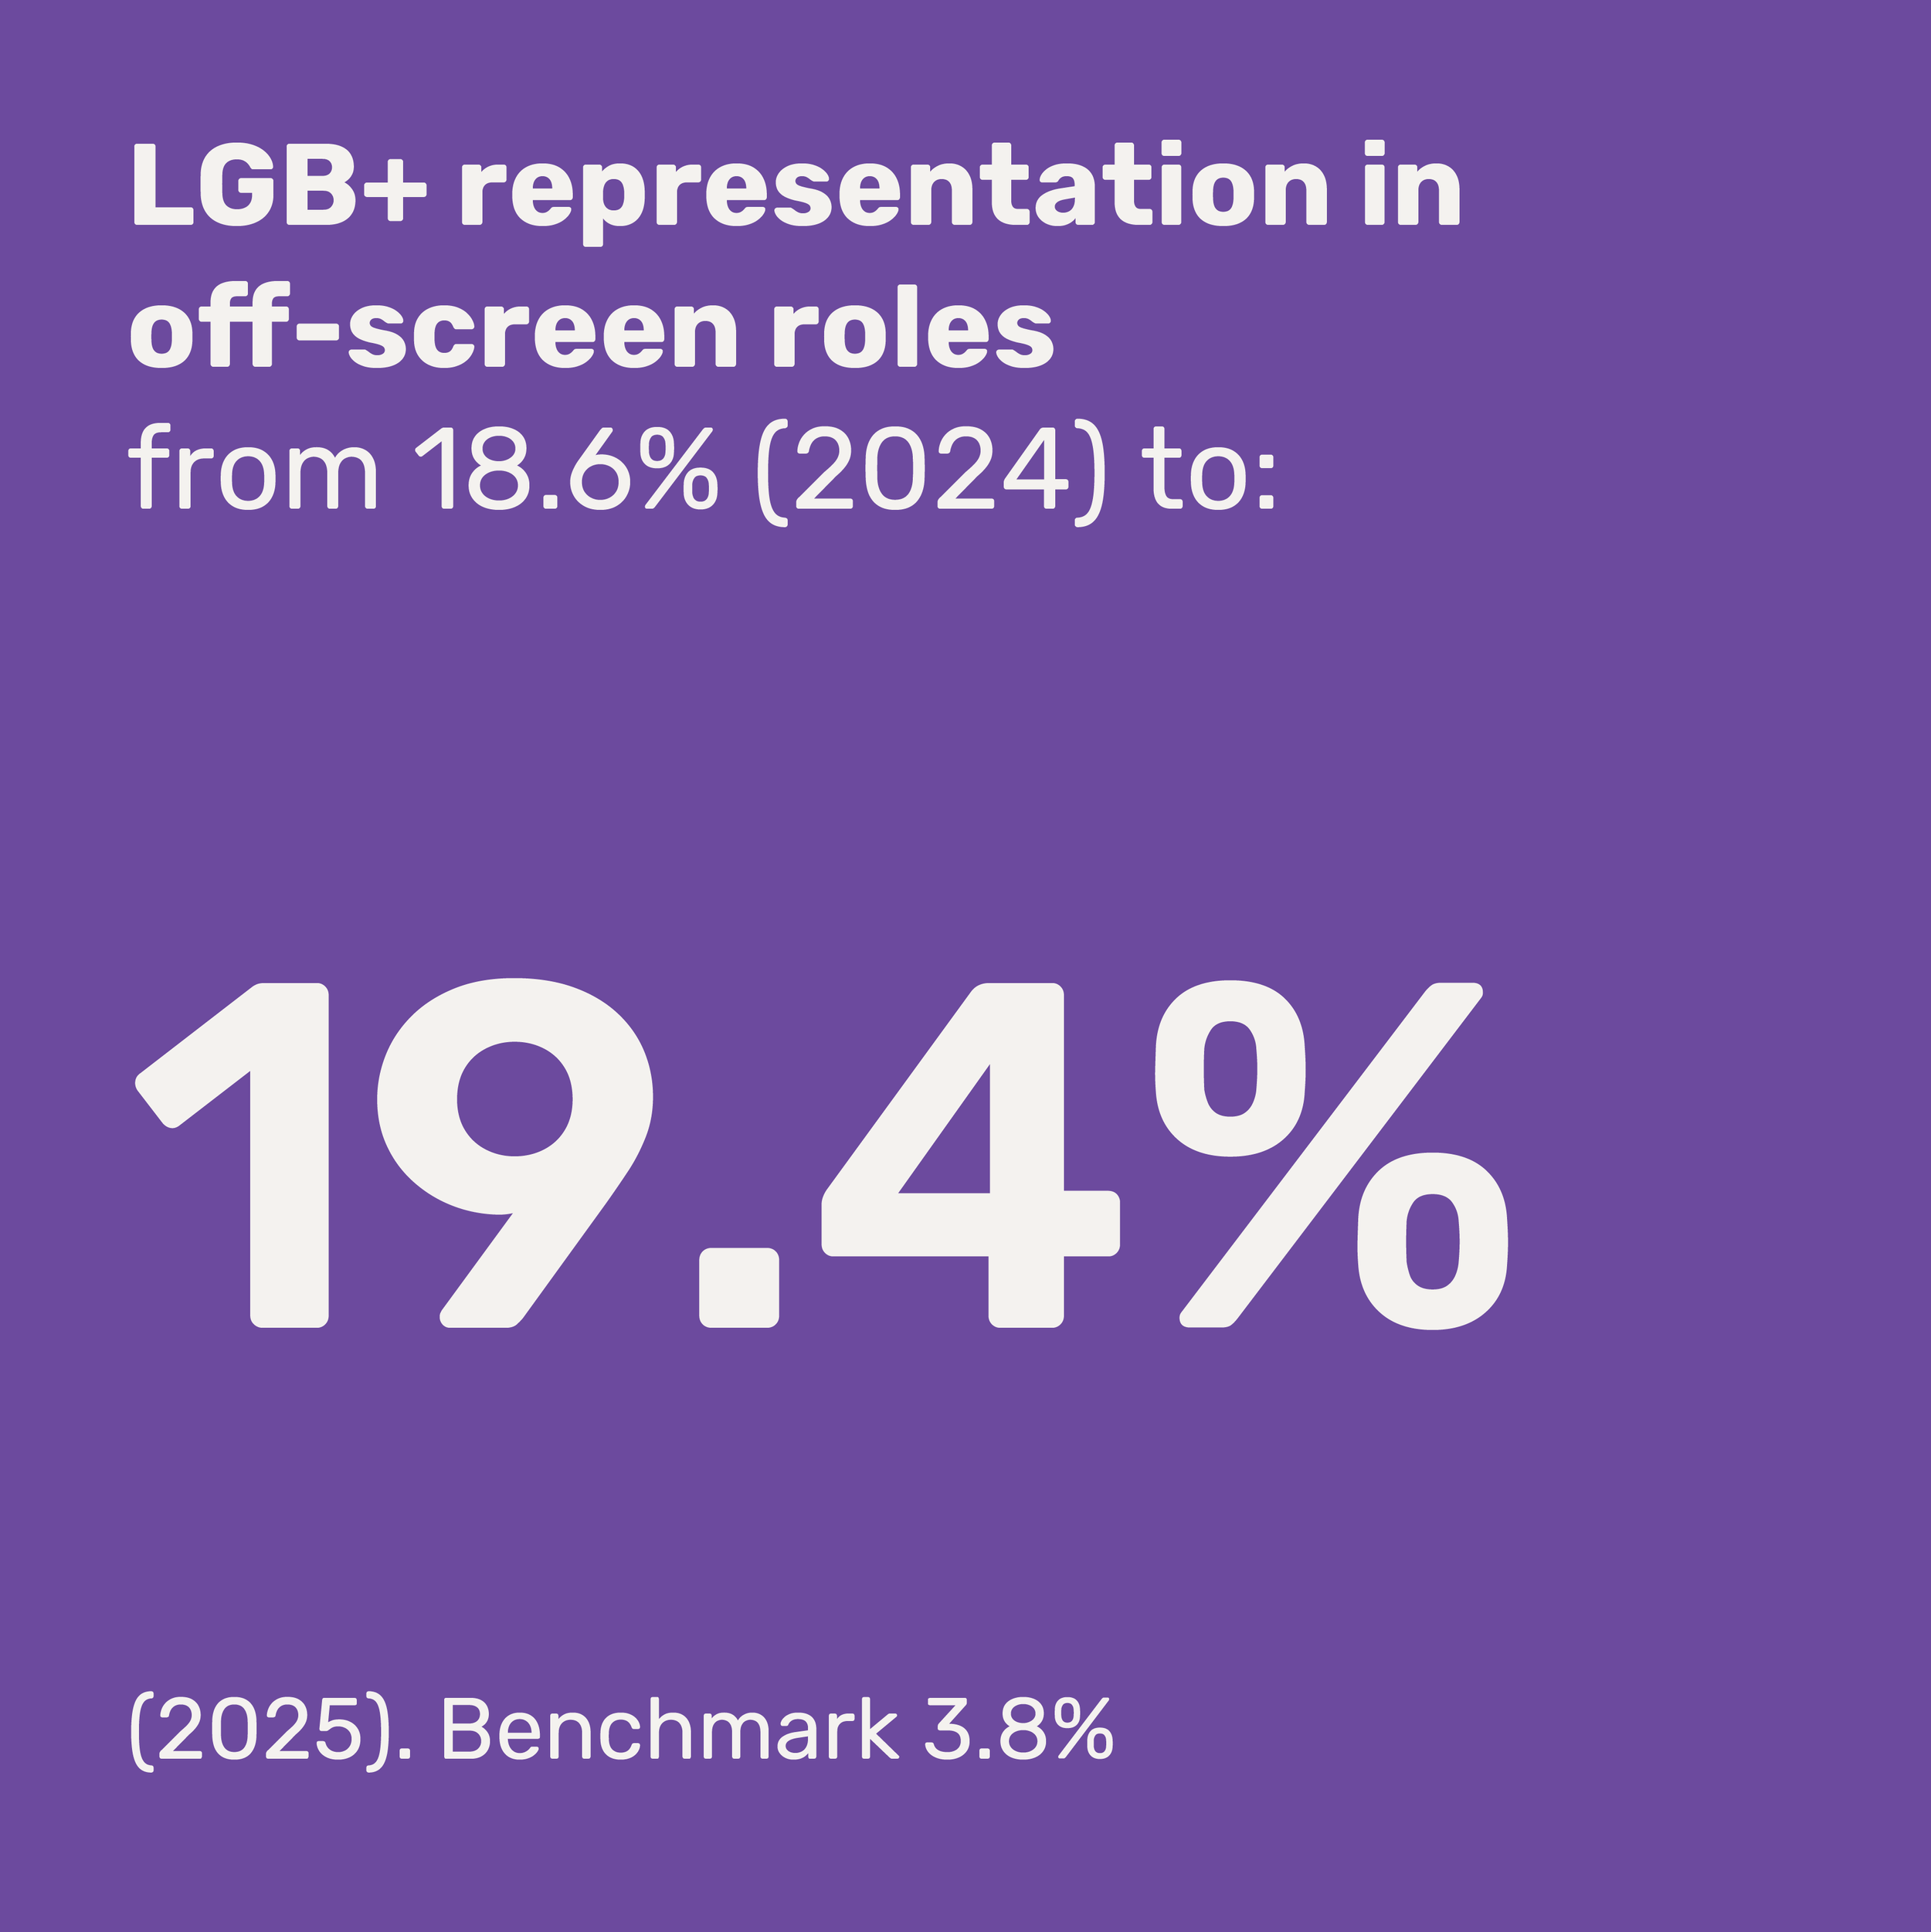
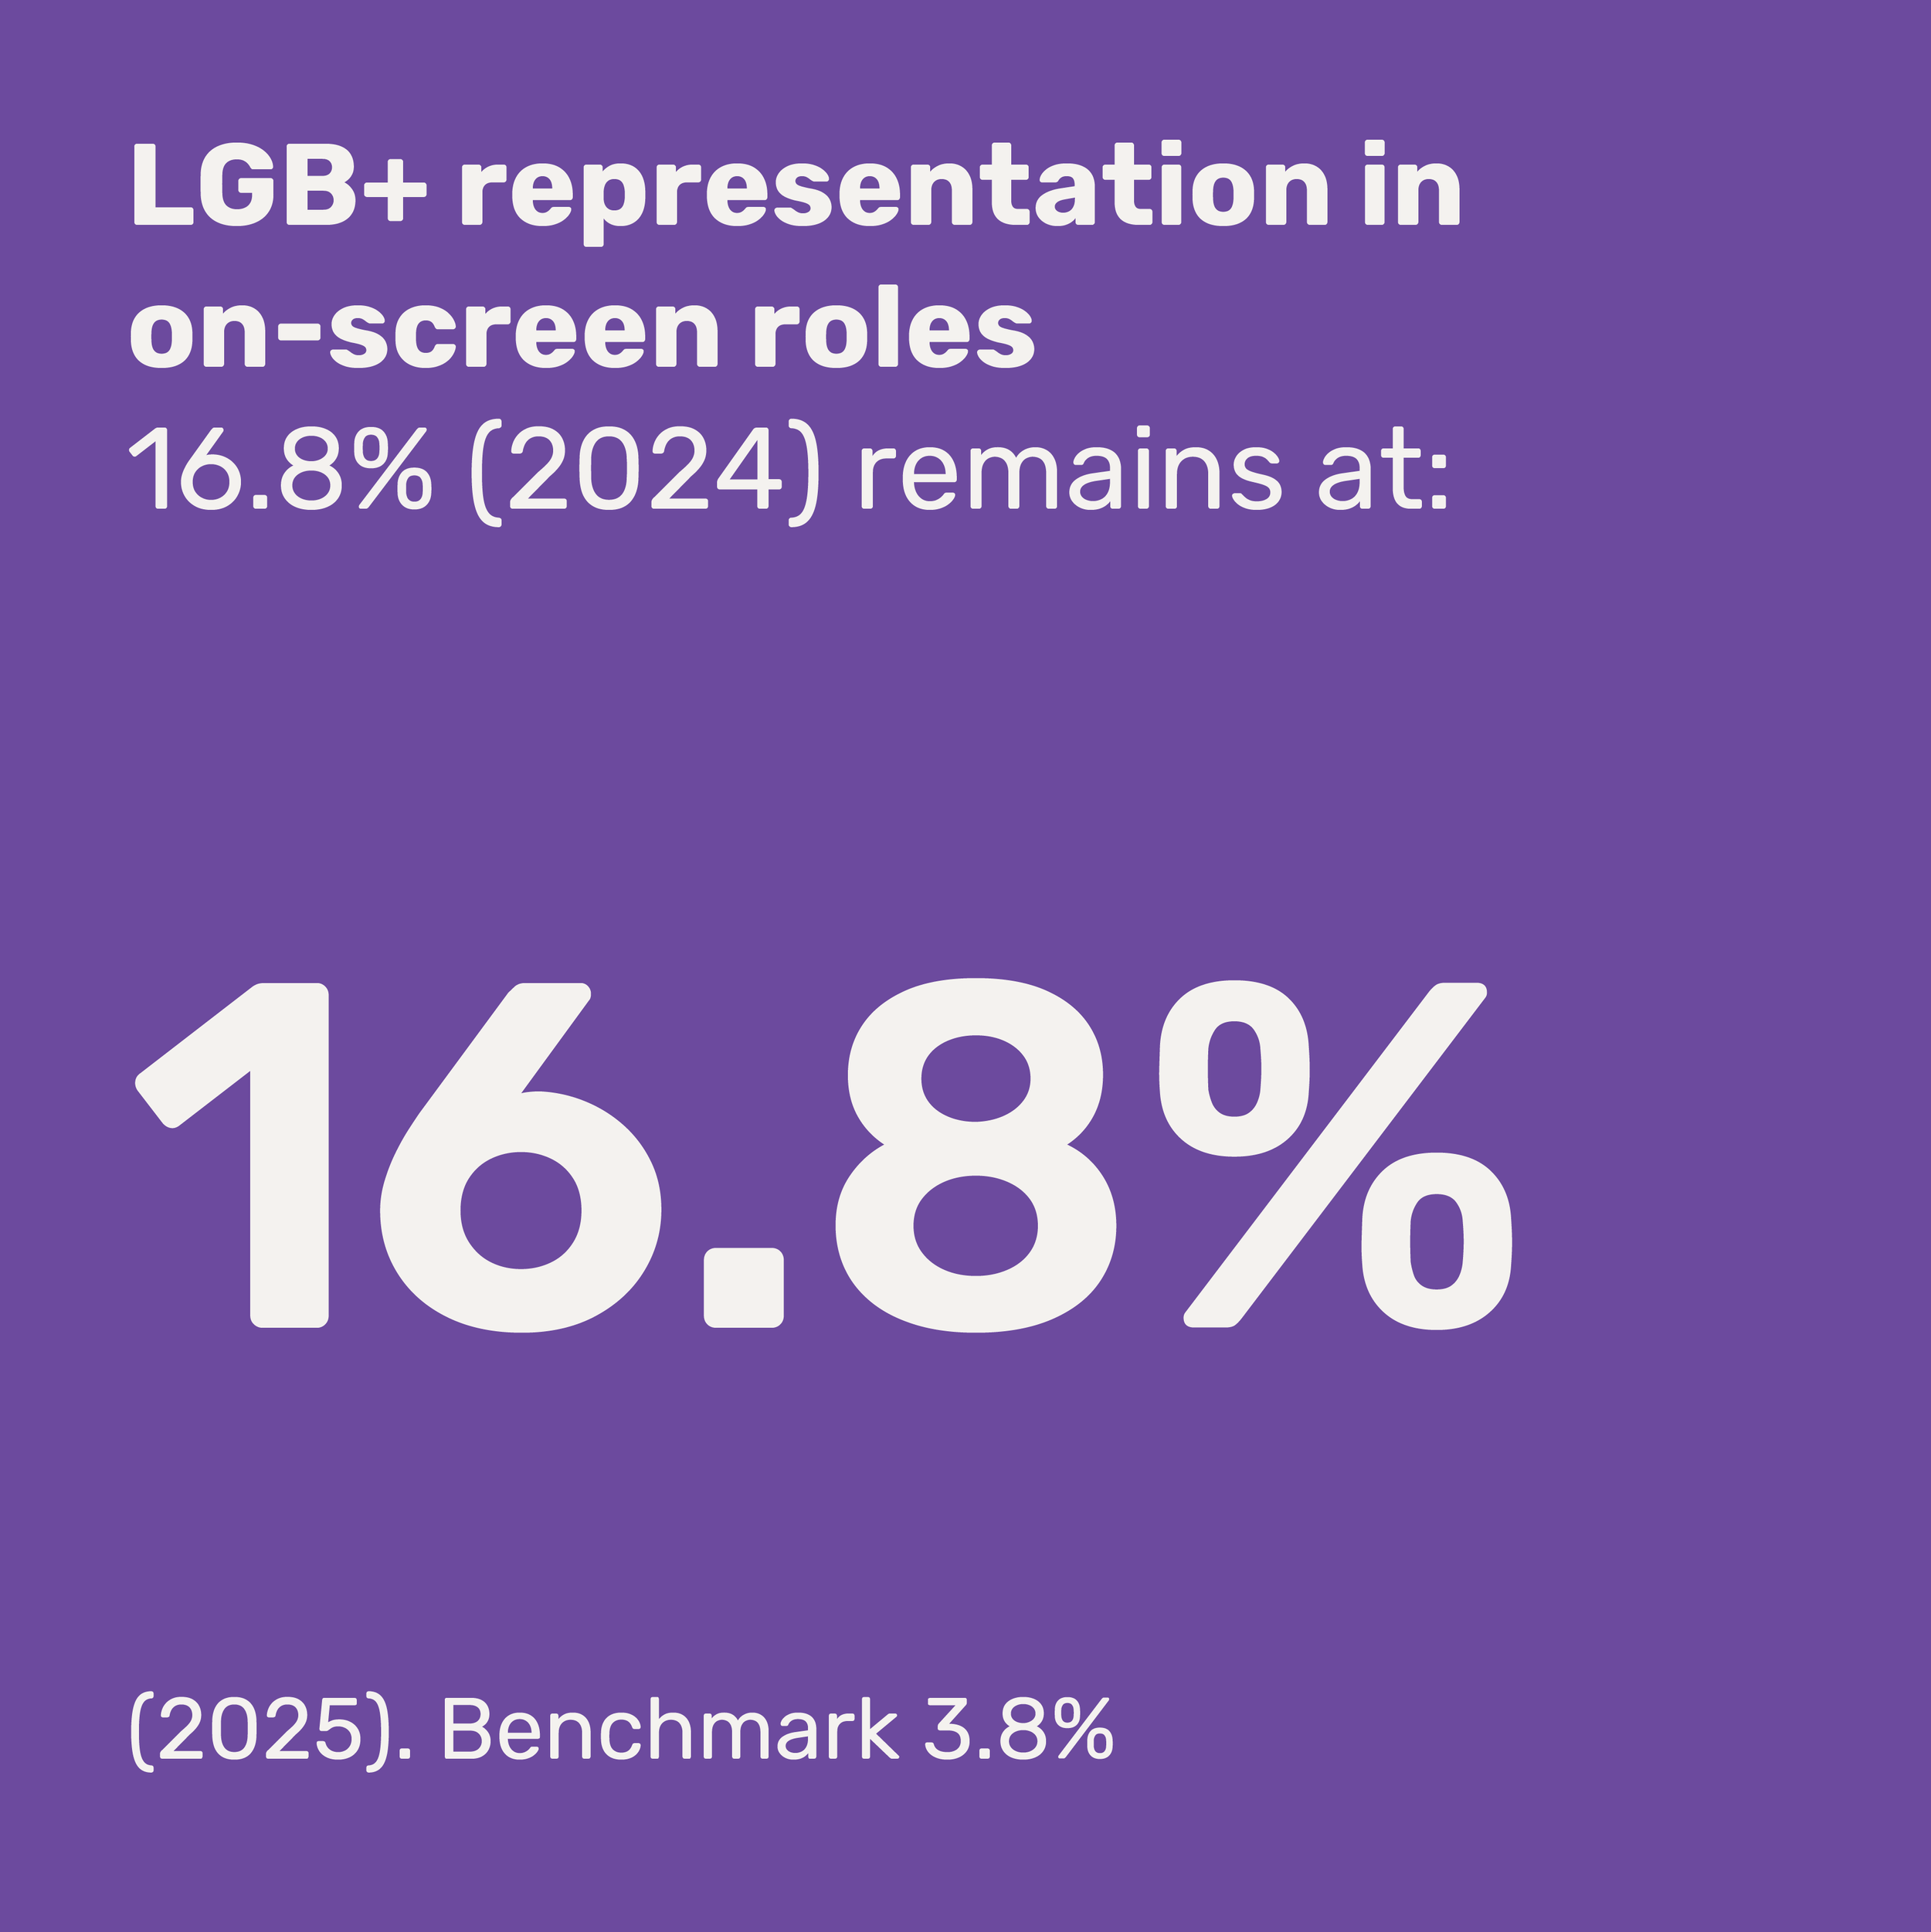
Overall, lesbian, gay, and bisexual (LGB+) representation remains very strong compared to the national population estimates (Annual Population Survey 3.8%). The proportion of contributions made by people who are lesbian, gay or bisexual also continues to increase, especially off-screen.
Genres
LGB+ representation is strong across all genres. An outlier is on-screen representation on Current Affairs programmes where lesbian women, gay men or bisexual people made relatively few (under 6%) contributions.
Off-screen
Gay men are more strongly represented in senior roles (11%) than other LGB+ groups, but in non-senior roles bisexual people (9%) are now making more contributions than gay men (7%).
On-screen
LGB+ representation is higher in scripted roles (19%) than non-scripted roles (16%), although lesbian women, gay men, and bisexual people are much more likely to appear in Supporting Actor (21%) rather than Lead Actor (12%) roles.